


 Custom services
 Spanish (pdf)
 Article in xml format
 Article references
 Send this article by e-mail
 Cited by SciELO
  Similars in
SciELO
Similars in
SciELO 
 Permalink
Introduction
According to the National Cancer Institute, breast cancer, lung and bronchial cancers, colorectal cancers, skin melanoma, bladder cancer, non-Hodgkin’s lymphoma, kidney cancer, and renal pelvic cancer are among the most common cancers.(1
Interleukin-2 (IL-2) was discovered as a cytokine. It supports the proliferation and differentiation of effector T cells, and it is used to treat melanomas or other cancers.2
The recombinant human IL-2 drug is approved by the US Food and Drug Administration for the therapy of melanoma and metastatic renal carcinoma. However, its use is limited for several reasons. IL-2 has a very short serum half-life (in the range of minutes), which dictates the use of very high doses of IL-2 to achieve an optimal immune-modulatory effect. Another limitation of IL-2 based immunotherapy is that it increases the activity of anti-inflammatory regulatory T (Treg) cells, which are known to suppress the immune response.3,4 Selective IL- 2 formulations such as IL-2 muteins, stimulate cells expressing high CD25 versus CD122 levels.5) The mIL-2 used in this research was mainly designed to expand effector cells instead of Treg.6)
The mIL-2 is obtained as an inclusion body (IB) from Escherichia coli BL21(DE3) cell line and it is purified after the biomass breakage. This is followed by IBs solubilization with sodium dodecyl sulfate (SDS), an oxidation controlled, and finally an Immobilized Metal-ion Affinity Chromatography (IMAC). Subsequently, a reversed-phase chromatography is performed to achieve a higher purity of the molecule. Finally, the in vitro renaturation of proteins is developed by a non-chromatographic ultrafiltration/diafiltration method. In this step, the protein is also concentrated in order to obtain the product to the final concentration for further administration.
Currently, the elution step is based on an imidazole solution, which increases the production costs in the non-alpha mIL-2 purification process.
The objective of this paper is to demonstrate the possibility of a new elution procedure in the IMAC chromatographic step in order to decrease production costs. With this aim, changes in pH values and molar concentration of the solutions used in the mIL-2 purification process are evaluated, which constitute the main contribution of this paper.
Materials and methods
Capture step of non-alpha mIL − 2 purification process
The non-alpha mIL-2 purification process consisted of three steps. First, a certain quantity of the IB precipitate was weighed, solubilized, and treated to complete the reduction of the disulfide bridge and to discard the solid. Second, a molecular exclusion chromatography took place using Sephadex G-25 Medium matrix (GE Healthcare, USA in a 26/20 column). Then, the solubilized protein was injected into IMAC on an XK 16/20 column (GE Healthcare, USA) packed with Chelating Sepharose Fast Flow matrix (GE Healthcare, USA) using Cu2+ ions from a CuSO4 solution (Merck). The target protein was eluted using the different elution buffers according to the experiment design.
Evaluation of a new elution variant using a DoE
A new elution variant in the IMAC step was proposed. Two factors were studied: pH and molar concentration, at two levels, 4-6 and 20-50 mmol L-1 respectively. Recovery (%), purity (%), and particle diameter (nm) were measured as response variables.
Besides Imidazole elution, decreasing pH (pH < 6) constitutes another elution alternative. Sodium acetate was used for pH 4 and 5 and sodium/potassium phosphate for pH 6. Solutions with a pH < 4 cannot be used due to the detachment of metal ion couple from the matrix. Different buffers were selected because the pH interval in which they work depends on their pKa. GE Healthcare recommends working in the molar concentration range between 20 and 50 mmol L-1.7,8,9,10
The column (XK 16/20) used for the DoE presents the following characteristics: height of gel = 5,50 mm; the volume of gel = 11,00 mL; applied solubilized volume = 25,00 mL; linear velocity = 36,60 cm h-1; volumetric flow = 1,20 mL min-1, and residence time = 9,90 min.
The protein concentration of each elution was assessed using the bicinchoninic acid (BCA) microassay. To determine purity, SDS-PAGE in reduced conditions was used. Moreover, dynamic light scattering (DLS) was used to characterize the size and size distribution of mIL-2 molecules in each elution. Finally, to specifically detect the presence of mIL-2 in each elution, a Western Blot (WB) using mIL-2 specific antibody was performed to select the best condition of the experimental design.
Determination of total protein concentration by BSA
A standard curve was prepared using bovine serum albumin (BSA). The samples were prepared by making serial dilutions with distilled water. In the 96-well microplate, a volume of 25 uL was added in triplicate for both the standard curve points and the samples. Later, 200 uL per well of the working solution was added. The plate was incubated at 37 oC for 30 min. Finally, the absorbance values were read at a wavelength of 540 nm.
Determination of recovery
The concentration of the non-alpha mIL-2 samples was determined by the BSA analytical technique. Next, the mass recovery of each chromatographic step was determined.
Purity analysis
The purity was determined by SDS-PAGE reduced conditions and the size by exclusion chromatography SEC-HPLC.
Analysis by electrophoresis in polyacrylamide gels in the presence of SDS (SDS-PAGE) and silver staining
The electrophoresis in polyacrylamide gels in the presence of SDS was done according to Ramón-Sierra et al.11 2,5 ug of protein was loaded to a 15 % polyacrylamide gel in reduced conditions and ran at 80 V for two hours. Then, the polyacrylamide gel was immersed in a solution containing 5 mL acetic acid (Panreac), 20 mL methanol, and 25 mL distilled water to fix the gel. Further, for the sensitization step, the gel was exposed to a solution of sodium thiosulfate (Panreac), sodium acetate (Panreac), glutaraldehyde, and distilled water. Finally, the gel was stained with a solution of silver nitrate (Panreac), distilled water, and formaldehyde (Spectrum). The silver solution was removed with distilled water for 10 seconds. The reaction was stopped by adding a solution of EDTA (Invitrogen) in 50 mL of distilled water.
Reversed-phase chromatography analysis by HPLC
To determine the purity, RP-HPLC was used. 60 µL of sample volume was injected and the flow rate was maintained at 1.0 mL/min. The buffer solutions were 0.1 % trifluoroacetic acid (TFA), distilled water plus 0.1 % TFA, and AcN.
Dynamic light scattering (DLS)
To determine particle size, DLS was performed in a Delsa Nano C (Beckman Coutler, USA). The measurement was made with a laser opening (Pinhole) of 50 µm, a temperature of 25 oC, and an angle of 165o. The measurements were performed in triplicates with 100 counts each using the statistical method of Cumulant.
Immunoblotting technique (Western Blot)
2 µg of protein was applied to 15 % polyacrylamide gels. Gels were transferred at 100 mA, 100 V, and 10 W for one hour. Once the transfer was completed, the membrane was blocked using 5 % milk in PBS for 1 hour. Then, the blot was incubated with a mIL-2 monoclonal antibody (CIM-Cuba) overnight at 4 oC. The next day, the membrane was washed three times with 1 X PBS-0,1 % Tween 20 solution for five minutes. The blot was incubated with an anti-mouse secondary antibody conjugated with horse radish peroxidase. Finally, the blot was exposed to the peroxidase substrate solution and bands were quantified.
Statistics methods
The obtained data do not follow a normal distribution. Therefore, the non-parametric Kruskal Wallis test was used to compare the results. This analysis was made using the statistical program Statgraphics Centurion version XVI.
Simulation in SuperPro Designer
The simulation, verification, and validation were developed on a pilot scale with the process´s real data (3/2020).
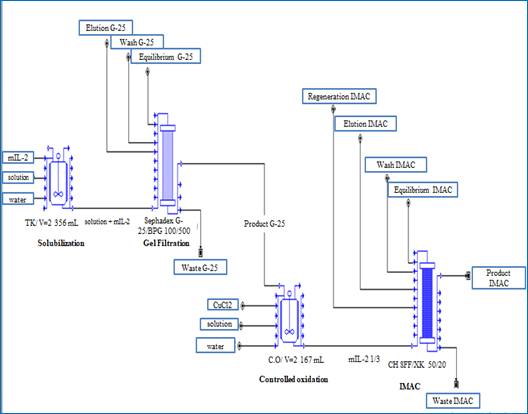
The basic case was considered as the capture step of the mIL-2 non-alpha purification actual process (elution with imidazole) where three final lots were taken. The process flow diagram was divided into four sections; representing every step of the process (figure 1).
Section 1: IB solubilization
This section includes the solubilization step of the IB precipitate. The biomass was weighed and solubilized with an extraction buffer in a stirring tank with a volume equal to 2,356 mL for two hours.
Section 2: Molecular exclusion chromatography
The solubilized was applied to the Sephadex G-25 Medium size exclusion column (BPG 100/500). The characteristics of the column are column volume (CV) = 3,93 mL and matrix volume = 2.35 mL.
The column was equilibrated for 54 min before applying the solubilized. The volume of solution to be eluted is equal to 4 CV and the total volume of equilibrium, wash, and elution solution is 10 CV. The product obtained was sent to the controlled oxidation section.
Section 3: Controlled oxidation
In this section, the disulfide bonds of the non-alpha mIL-2 were formed, using the agitation tank with a volume equal to 2,17 mL. The elution from the previous section was diluted three times with the equilibrium solution. Then, a volume of copper chloride 2 mmol L-1 was added until the final concentration of 50 µmol L-1 was reached and it was incubated for 90 minutes.
Section 4: Immobilized metallic affinity chromatography
The obtained product was applied to an affinity column with Chelating Sepharose Fast Flow matrix. The column characteristics are: column volume = 392,7 mL and chromatography gel = 250 mL. The binding capacity of the resin was 3,5 mg mL-1 and it was equilibrated for 50 min before applying the solubilized. The total volume of the equilibrium, elution, wash elution, and regeneration solution was 15 CV.
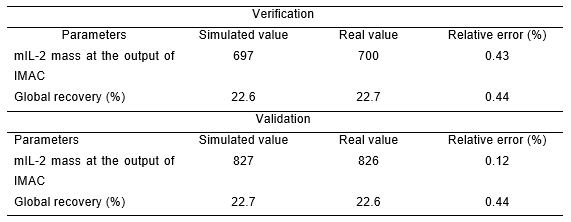
Simulation verification and validation
To verify that the results obtained by the simulation reproduce the process conditions, the product mass obtained at the output of IMAC and the recovery in this step were compared to the real values of the same batch.
The simulation model responds to a real situation if the calculated relative error is less than 5 % (equation 1).

To validate that the simulation represents the real world from the modeler’s perspective, the mutein at the output of IMAC was compared in the same way as a function of another batch. The same comparative analysis for the recovery was performed. Table 1 shows the batches used for the simulation, verification, and validation.

Economic evaluation
Changes in the case study were made in order to determine the influence of gel volume on recovery, productivity, and cost of the capture step. Equation 2 was used to calculate the productivity:

Total costs of all variants were obtained taking into account the precipitate solubilization, exclusion molecular chromatography, controlled oxidation, and IMAC steps.
Production costs are divided into two parts: operation costs and general expenses. The operation costs consist of direct (DC) and indirect (IC) production costs. Direct costs contain raw materials, salaries of personnel directly involved in the production process, auxiliary services, maintenance and equipment repair, and expenses of quality and process control laboratories. On the other hand, indirect costs contain expenses that have little differences compared to the production volume variation.
In the economic evaluation, the costs contributed by the equipment depreciation were included, as well as general expenses.
Table 2 shows indicators used in the center’s Economy Department to carry out the process of economic evaluation.
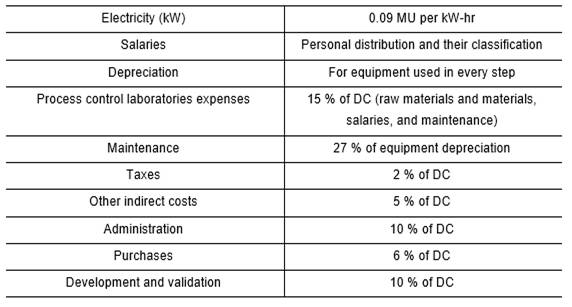
Expenses for raw materials and materials were calculated using the consumption rates made for production and the prices provided by the center´s Economy Department.
Results and discussion
Influence of selected parameters on recovery, purity, and particle diameter in the capture stage of the non-alpha mIL-2 purification process
The new elution variant evaluation (by pH) in immobilized metal ion affinity chromatography took place at a laboratory scale. A 22 factorial design with a central point and two replications are used. Therefore, 15 experiments were performed. From this design, the elution buffer which provides a higher recovery and purity and smaller particle diameter should be obtained. This selected elution buffer is used for subsequent analysis of parameter changes. The values of the response variables are shown in table 3.

Obtained results of recovery and purity were similar to real results, where imidazole elution is used.
Recovery
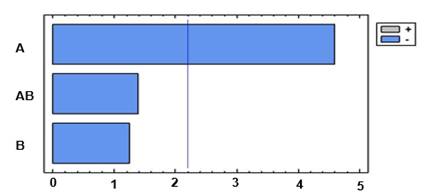
The Pareto diagram (figure 2) shows that pH is the only significant factor. This result is expected because some fundamental studies have indicated that the adsorption-desorption process by proteins affinity in the IMAC column is related to the operating conditions: pH and ionic strength.12) The results corroborate those reported by some authors.(13) In this paper, the authors established that in affinity chromatography for metal chelates, the decrease in the pH value causes the protonation of the histidine hydrogen group. This causes the coordination bond between the transition metal and the histidine to be disrupted.13 Therefore, a lower pH value results in greater protonation and greater bond breakdown.
However, the evaluated condition at pH 6 shows a decrease in the recovery values. A progressive decrease from pH 7 to 6 shows a sudden transition to pH 6.5 which indicates the participation of histidine having a pKa 6.5.12) In this pH range, the contribution of histidine residues towards the adsorption of proteins in IMAC and not towards the elution of the protein is further established
The equation of the fitted model for the uncoded variables, once the non-significant terms have been eliminated, is:

Purity
Reverse-phase high performance liquid chromatography (RP-HPLC) was used to evaluate elution’s purity for each condition. As can be appreciated in figure 3, the variable that most affect the purity is the molar concentration with a negative correlation.
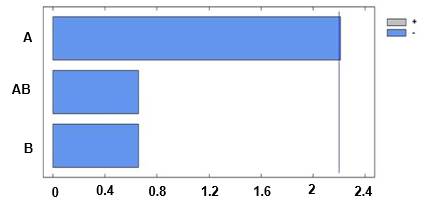
Using Statgraphics Centurion software, a fitted model for the purity response variable is obtained as a function of the molar concentration. The model is:

Particle diameter
Particle diameter values for each condition were determined by the DLS technique. Each peak obtained in the size distribution graphs represents the formation of a group of particles. For conditions 1, 2, and 3, one peak was observed, and for conditions 4 and,5 two peaks were observed.
Figure 4 shows the influence of pH and molar concentration on particle diameter. In this figure, positive correlations and significant influences in the particle diameter can be observed.
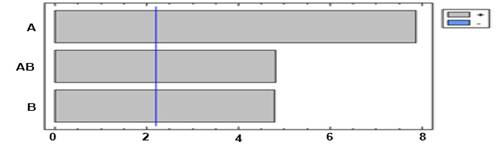
Fig. 4 Pareto diagram for the diameter particle. A: pH; B: Molar concentration; AB: pH + molar concentration
This result is expected because pH constitutes a critical factor that induces the aggregation of proteins.14) The pH can strongly affect the rate of aggregation by changing the type and distribution of proteins’ charges. Figure 5 shows the main effects diagram on the particle diameter, which indicates that if any of the evaluated factors are increased then a rise in particle diameter is produced.
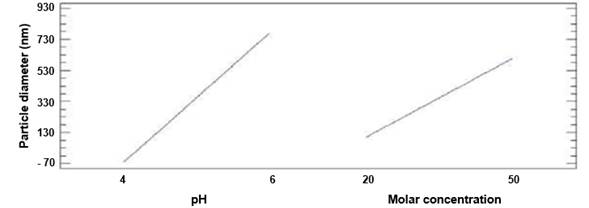
Therefore, pH or molar concentration should not be increased. Butz and Devenish15, reported similar results studying the stability of the human IL-2 molecule under different conditions, buffer solutions, and temperature. In15, size and concentration over 24 h were evaluated. It was found that the phosph ate-prepared samples tended to aggregate, while the acetic acid-prepared samples remained monomeric during the observation period. In the experiments developed in this research, the use of the DLS technique confirms that the conditions evaluated with Na+/K+ phosphate present greater aggregation (greater diameter) than the conditions evaluated with sodium acetate.
In this case, the fitted model for the particle diameter is obtained:

DoE optimization
According to our results, pH can be considered as the factor with the highest influence. This is related to modifications in protonation as pH changes, due to the histidine tail behavior in the presence of the chelating agent Cu2+. Furthermore, it is considered one of the main factors that influence protein aggregation.
In order to determine the combination of experimental factors that simultaneously optimize several responses, a multivariate optimization analysis was performed. The desirability function method was used as a solution to combine the responses of multiple factors in a function. The objectives for each one of the responses were established as maximizing recovery and purity and minimizing particle diameter16.
The maximum desirability was achieved using pH 4 combined with 20 mmol L-1 molar concentration, where the composite desirability (0,90) is close to 1. In this condition, 29 % recovery, 90 % of purity, and a particle diameter of 18.40 nm could be obtained.
Physico-chemical characterization of non-alpha mIL-2 in the capture stage of the purification process for the best elution condition
The physic-chemical characterization of the mIL-2 obtained with the best elution condition (sodium acetate 20 mmol L-1 pH 4) is performed. The chromatographic profile is analyzed by using RP-HPLC. Later, electrophoresis under reducing conditions is performed. Finally, DLS is used to obtain the particle diameter.
Non-alpha mIL − 2 RP-HPLC Purity for New Elution Solution
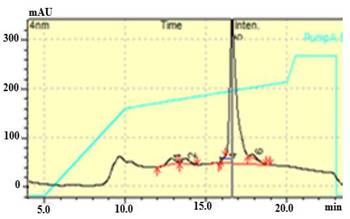
Figure 6 shows the representative profile made with the elution solution: sodium acetate 20 mmol L-1 pH 4. The profile obtained is characterized by a majority peak and three minor peaks. It can be seen that the major peak corresponds to the protein of interest with an approximate retention time of 17 min. Meanwhile, the minority peaks are reached at 13, 14, and 17,5 min approximately. In this condition, an average purity equal to 90.6 % is reached.
Purity analysis by SDS-PAGE of non-alpha mIL-2 for optimal elution condition
Figure 7a shows the electrophoresis developed with the optimal elution condition. In this figure, only two runs are observed, since the results of the second and third run are similar. The presence of a majority band approximately at 18 kg mol-1 (molar mass of the target protein in its monomeric state) can be seen in all lanes. Additional bands of higher molar mass are also observed in the elution, which may be associated with aggregates or contaminants. No bands are observed below the majority band, which indicates that no degradation occurred, and other pollutants of lower molar mass are not detected.
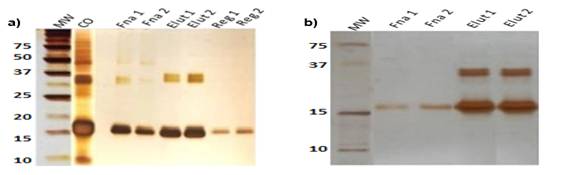
Fig.7 (a) Electrophoresis in 15 % acrylamide in reducing condition for the condition 20 mmol L-1 sodium acetate pH 4. (b) Western Blot for the condition 20 mmol L-1 sodium acetate pH 4
Where:
MW: molecular weight;
CO: controlled oxidation;
Fna 1: fraction not absorbed run 1;
Fna 2: Fraction not absorbed run 2;
Elut 1: Elution run 1;
Elut 2: Elution run 2;
Reg 1: Regeneration run 1;
Reg 2: Regeneration run 2.
Figure 7b shows the Western Blot performed on the samples obtained with the optimal elution condition. The presence of the protein of interest in the previously defined interval can be observed in the lanes corresponding to the elution. The bands that appear at approximately 36 kg mol-1 are not due to contaminants present in the sample. They are associated with different states of aggregation of the molecule (dimeric species).The results obtained in the WB experiment indicate the molecular complexity and the enormous challenge that represents the mIL-2 molecule to obtain high values of purity, low diameter, and high values of recovery due to its high degree of aggregation.
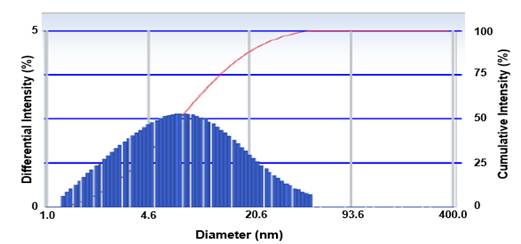
Non-alpha mIL − 2 particle diameter analysis by DLS
The theoretical particle diameter for molecules of approximately 150 kg mol-1 such as monoclonal antibodies (mAbs) can be between 5,2 nm and 10 nm. For molecules of approximately 19 kg mol-1 an expected diameter is 3,24 nm.13In the present research, the mean values of the particle diameter obtained are between 17 and 1 356,7 nm, which suggests the presence of aggregates in the sample with a molar mass greater than 150 kg mol-1.17,18). Formation/exchange of disulfide bonds and oxidation are the main possible reactions that cause aggregation.
Figure 8, shows the presence of a single population of particle size with high polydispersity (peak width: 0,330) with an average diameter of 18,4 nm.
The particle diameter obtained in this research is higher than the expected value for a molecule of approximately 18 kg mol-1 and the polydispersity index is greater than 0,1, therefore. With this analysis, it could be concluded that the non-alpha IL-2 mutein aggregates and these aggregates have different molecular sizes.
Verification and validation of the base case simulation
The values obtained in the simulation were compared with one of the batches of a run production in 2020. Table 4 summarizes the most important parameters of the process. These parameters were taken as a reference to carry out the verification and validation.
From table 4, it can be seen that the values simulated by SuperPro Designer were very close to the values obtained in real production. In both cases, the relative error for the parameter in both verification and validation was lower than the established norm. Taking into account the values obtained and the fact that a biological process presents variations, the model was verified and validated.
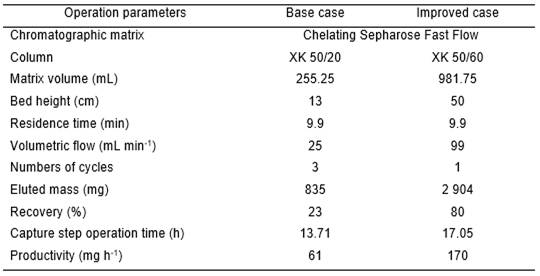
Evaluation of the base case and improved case economic feasibility
In the base case, an XK 50/20 column with a matrix gel of 250 mL was used. There, with three cycles, 23 % of the protein is obtained and the productivity in this step is equal to 61 mg h-1.
To increase the recovery and productivity in the capture step, an improved case of the IMAC was developed.
In the improved case, a new alternative was evaluated, which consisted in increasing the matrix volume in IMAC to improve the recovery and decrease the number of cycles. Those changes influenced other parameters like chromatography column type and volumetric flow. Tables 5 and 6 show the operation parameters and operation costs used in every case respectively.
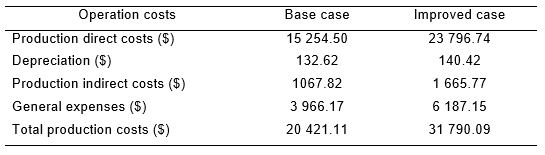
The new alternative shows an increase in the production cost of the capture step concerning the base case. This is due to the acquisition of a larger chromatographic resin volume to achieve greater use of the production capacity in this step.
The new alternative increased the mutein mass by 47,5 %. Therefore, the productivity obtained with the improvement alternative turned out to be 2,78 times greater than the case base productivity. Despite this alternative is more expensive, it is possible to achieve the desired increase. The income generated by the increment in protein mass is favored, increasing by 879 325,00 $. In conclusion, the benefits exceed the increase in costs.
Conclusions
In this paper, a DoE testing five elution solutions was developed, and the recovery, purity, and particle diameter as response variables were measured. The manipulated variables were concentration and pH. The best result was obtained using the 20 mmol L-1 sodium acetate pH 4 solution with a 29 % recovery, 90 % purity, and 18,40 nm particle diameter. These results are similar to those obtained in the current production process where an imidazole-based elution is used. The other four solutions induce a great instability in the mutein, evidenced by the high level of aggregation, especially when using phosphate buffer pH 7. Similar results demonstrate the possibility to use a new elution form.
In addition, the real process capture step was verified and validated using the SuperPro Designer program, obtaining in both cases an error of less than 5 %.
An increment of the matrix CH SFF gel volume leads to an increase of 11 369 $ in the total cost of the studied step concerning the base case. However, it is possible to obtain higher productivity with 109 mg h-1, which translates into a growth in the mIL-2 no alpha production of 47,0 % and an increase in the gross net by $879 325 compared to the base case.

