


 Custom services
 English (pdf)
 Article in xml format
 Article references
 Send this article by e-mail
 Cited by SciELO
  Similars in
SciELO
Similars in
SciELO 
 Permalink
1.-INTRODUCTION
Human Computer Interaction (HCI) technology has been the objective of great focus in the past years. BCIs are the latest development in this field. Unlike other devices, BCIs read brainwaves in different locations in the scalp, and then translate these waves into actions or commands. Most BCIs applications are aimed at helping disabled people to interact with different computational devices. They can also be used by gamers to play using their heads, as new ways of social interaction, and to enable social applications to capture feelings and emotions[1-3].
In the BCIs design, EEG signal processing aims at translating raw EEG signals into certain class corresponding to the user mental state. This translation is usually achieved using a pattern recognition approach, which consists of two main steps: feature extraction and classification. The first step aims at describing the EEG signals by a few relevant values called “features”. Such features should capture the information embedded in EEG signals that is relevant to describe the mental state to identify, while the second step, the classifier, assigns a class (associated with a mental state) to the set of features extracted from the signals[4].
One major challenge in the field of BCIs is to extract reliable information from noisy data in real time in the form of relevant features. In order to do this, several feature extraction algorithms have been proposed over the last years, with Principal Component Analysis (PCA), Common Spatial Pattern (CSP), Fast Fourier Transform (FFT), Autoregressive Coefficients (AR), Wavelet Transform (WT) and Phase Synchronization (PS), being among the most commonly used [5-9]. Physiological arguments suggest that the frequency bands around 8-13 Hz and 14-30 Hz are especially relevant for discriminating motor activity in the upper limbs[10]. A common approach is thus to extract the power information from the signal over these frequency bands and use that as the classification feature [10-13]. To do this, the most popular methods for power spectral estimation are the ones based on the FFT like the one proposed in [14], but other band power based feature extraction algorithms have been proposed [15]. The autoregressive coefficients (AR) and the Discrete Wavelet Transform (DWT) are also used to calculate the spectral density in specific frequencies. Within these algorithms, the decomposition of the EEG signal using the DWT and WPD have been the feature extraction methods that provide better results, using as feature vector the energy in the Wavelets sub-bands, obtaining in most cases more than an 80% accuracy during classification [13, 16-23].
The classification algorithm is as important as the feature extraction method. Nonlinear methods have shown better classification performance compared to the linear methods; however, they are more complicated to implement. Linear classifiers, such as Linear Discriminant Analysis and Support Vector Machine (SVM) are more suitable for real time BCIs systems implementations because of a low computational cost, which have persuaded researchers to use it in the classification of biomedical signals [24-26]. In [27], the author carried out a comparison between LDA, SVM and an artificial neural network based classifier during the classification of motor imagery tasks. He concluded that although the neural network classifier offers a slightly better accuracy over the LDA classifier, the latter offers a simpler implementation and a better analysis of the classes when the estimation of power spectral density is used as a feature vector.
Despite the amount of research conducted in this field, many promising systems still remain confined to research laboratories, with studies investigating their long term use for patients who have most need of them[9]. One of the reasons for this delay in bringing BCIs to the home user has been the need for a bulky personal computer performing the analysis of brain signals and translation into output commands. Hence, there has been growing interest in developing BCIs on mobile platforms[28]. Based on that, the aim of this paper is to aid in the solution of the problems presented by the limitations of today’s BCIs technologies for motor rehabilitation and the instrumentation where the feature extraction algorithms and classification algorithms are implemented, considering the power consumption and delay of these algorithms.
FPGAs have the advantages of parallel processing to provide higher performance over digital signal processor (DSP) for real-time multi-channel signal processing. They also have the flexibility of reconfiguration, making it more preferable for proof-of-concept prototype design than application-specific integrated circuit (ASIC)[14]. While in a typical BCI system only the initial stages of signal acquisition and amplification would be performed in hardware and the remaining ones (artefact suppression, feature extraction and classification) would be implemented in software, shifting this hardware-software interface even further would allow lower power consumption, greater compactness and parallel feature computation[9]. Among the first publications to propose a complete BCI system on a FPGA were [29] and [28], where the authors aimed their design to detecting and processing steady state visual evoked potential (SSVEP) and P300 potential respectively. Although potentials like P300 can be evoked in nearly all subjects, and are relatively easy to detect[28], BCIs systems based on them would present limitations for patients with visual or eye muscle problems. Such limitations are not found in BCIs based on motor imagery due to the use of Event Related Desynchronization/Synchronization (ERD/ERS) potentials [30]. Other P300 based BCIs embedded on FPGA found in literature are [31, 32]. In 2014, a motor imagery based BCI system embedded on FPGA was presented in [33], in order to control basic home devices by the thought of two motor imagery actions: left hand and right hand movement. This system performed the entire signal-processing tasks on software running on a Nios II processor embedded on a Startix IV FPGA, using CSP as feature extraction algorithm and the Mahalanobis Distance (MD) as classifier. This resulted on a lower FPGA resource consumption, but at the expense of a 0.5-second delay in the execution time. In [34] another motor imagery based BCI system is proposed, performing the feature extraction with the Discrete Wavelet Transform in combination with a SVM classifier, using Verilog Hardware Description Language. But the authors do not provide any information about the FPGA resource consumption or the delay of the system. In [35], a low power hardware implementation of a BCI is designed, reducing up to 56 times the power consumption compared with BCIs that use digital filters. They achieved this by using the Discrete Cosine Transform as feature extraction and reducing the clock frequency to 0.5 MHz. An improvement of [33] can be found in [36], where the authors accelerated some of the critical tasks in hardware, but still performing great part of the processing in software, reducing the delay from 0.5s to 0.399, using again CSP as feature extraction and MD as classifier. A more complete work about ERD/ERS BCIs is addressed in [30], where the authors proposed a complete hardware implementation of a BCI embedded on FPGA, using Separable Common Spatio Spectral Pattern (SCSSP) as feature extraction algorithm, which improves the CSP method[37], and SVM as classifier. In this work, a different approach is proposed using only 2 EEG channels instead of 14 or 22 channels like [30] and [33, 36] respectively, making a greater emphasis on the frequency properties of the EEG signals instead of the spatial ones.
As the contributions in this paper, a System Generator model is proposed for a hardware efficient implementation on FPGA of a motor imagery based BCI. A modular design is used in the implementation of the feature extraction algorithm, based on WPD, which in combination with an LDA classifier provides an 80 % of accuracy for a case study, in the recognition of two mental state classes (right hand movement and left hand movement). The design is compared with similar designs on previous works, where they use CSP or a similar algorithm to extract features from the EEG signal. This comparison shows that the design proposed in this paper achieves a lower consumption of FPGA resources and a lower latency than the previous works.
The rest of the paper is organized as follows. In section 2, a general description of the proposed system and the dataset employed is provided. Section 3 describes the details of the feature extraction and classification algorithms. Section 4 addresses the hardware design and in section 5, the results of the classification and the hardware implementation are discussed. Finally, in section 6 the conclusions are presented.
2.- PROPOSED BCI DESIGN
A BCI system is the combination of a signal acquisition hardware, a pre-processing stage, a feature extraction algorithm, a classification algorithm and a feedback or command stage[38]. This work focuses on the embedded implementation on FPGA of the more critical parts of that kind of systems, the feature extraction and classification stages, contrary to most works found in literature [30, 33, 36] about the implementation on FPGA of ERD/ERS based BCIs, where they use some type of spatial filters as the feature extraction algorithm. In this paper, the features extracted are the energy in 8 frequency bands (0-4Hz,4-8Hz,8-12Hz,12-16Hz,16-20Hz,20-24Hz,24-28Hz,28-32Hz) of each EEG channel employed. In order to do this, each EEG channel is decomposed up to four levels with WPD and the normalized energy of each band is calculated. Once the features of all channels have been extracted, an LDA classifier assigns a class (1 or 2) to each feature set, indicating the movement of the right hand or the left hand. A general diagram of the system is illustrated in Figure 1.

2.1.- DATASET BCI COMPETITION 2003
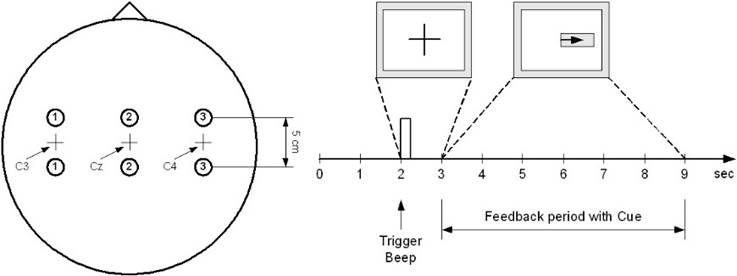
To train and test the BCI system, a dataset of real EEG signals was employed, provided by the department of Medical Informatics of the Institute for Biomedical Engineering, University of Technology Graz. These signals were recorded during the event BCI competition 2003. During this event, several datasets were recorded from multiple subjects, while they performed different tasks. In this paper, the dataset employed was the one labeled: III Motor Imagery, recorded from one subject. The subject was a 25- year- old normal female, who sat in a relaxing chair with armrest. The task was to control a feedback bar in one dimension by imagination of left or right hand movements. The order of left and right cues was random. The experiment included seven runs with 40 trials each. All runs were conducted on the same day with breaks of several minutes in between. The dataset consists of 280 trials of 9 seconds each. In each trial, the first 2 seconds were quiet, at t=2s an acoustic stimulus indicates the beginning of the trial, and a cross “+” was displayed for 1s. Then, from t=3s to t=9s, an arrow (left or right) was displayed as a cue. At the same time, the subject was asked to use her imagination as described above to move the feedback bar into the direction of the cue. Three EEG channels were recorded (C3, Cz and C4) using the bipolar electrode configuration shown in Figure 2, for the recording a g.tec amplifier and Ag/AgCl electrodes were employed. Each channel was sampled at 128 Hz and the data filtered between 0.5 and 30Hz. The trials for training and testing were randomly selected to prevent any systematic effect due to the feedback[39].
From the 280 trials, only 140 contain the class label ‘1’ or ‘2’ for left and right hand respectively, so from those 140 trials, 70 were used to train the system and 70 to test it. Using from each trial only last six seconds.
3.- ALGORITHMS DESCRIPTION.
3.1.- WAVELET TRANSFORM
Fourier analysis is ideal to explore signals with stationary data but it is not suited for information with transients that cannot be predicted from data’s past. The signal is either spread in the time domain and localized in the frequency domain, or localized in time domain and spread in the frequency domain. In signal processing terms this means that it is difficult to determine the exact time at which a specific frequency component will appear. These limitations are overcome by the Wavelet transform since it allows time-frequency localization and the study of signals with non-stationary data. The analysis using Wavelet transform is done by splitting a signal into components, which are called Wavelets[40]. The Continuous Wavelet Transform (CWT) of a time signal x(t) in defined as:
In equation 1, Ψ(t) is a function with limited duration in time, b is the shifting parameter and a is the scaling parameter (replacing frequency parameter f). As can be seen, the basic functions (Ψ((t −b)/a)) of the CWT are the shifted and scaled version of Ψ(t), this function is often referred to as the Mother Wavelet. The discrete version called Discrete Wavelet Transform is achieved by applying only discrete shifts and scales to the Mother Wavelet and can be implemented using a two channel Finite Impulse Response (FIR) filter bank, one low pass filter and a mirror high pass filter, where the outputs of each filter are down-sampled by a factor of 2[41]. The schematic for a two level DWT decomposition is shown in Figure 3:
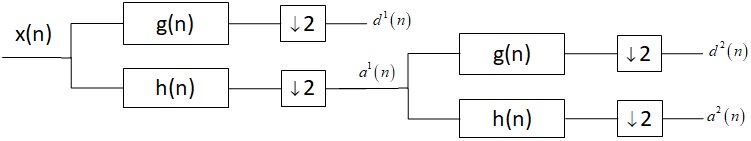
The a(n) are defined as the approximation coefficients which contain the low frequency components of the signal, and d(n) the detail coefficients, which contain the high frequency components of the signal. For the filter bank, the high pass and low pass filter coefficients are obtained using equations 2 and 3 in which g(i) and h(i) are the filters coefficients shown in Figure 3. In these equations Φ(n) is defined as the scaling function which is for local approximations in the same way as the Wavelet function is for fluctuations around the local approximation[41].
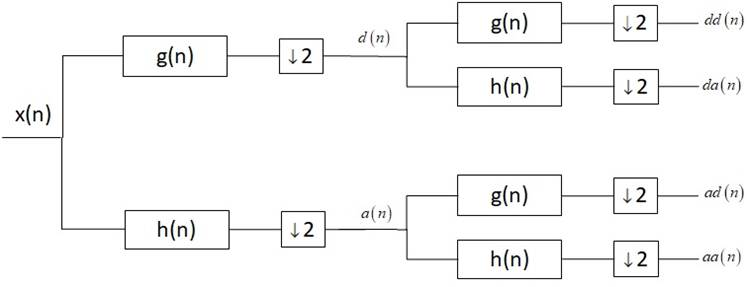
A generalization of the orthogonal Wavelet decomposition can be found in a procedure called Wavelet Packets Decomposition. This procedure allow a finer analysis by breaking up the detail spaces, which are never decomposed in the case of the DWT, mitigating the lack of frequency resolution. The principle is, to decompose not only the approximation coefficients but also the details coefficients[41], as shown in Figure 4.
For a decomposition level J there are 2j terminal nodes that cover a frequency range from 0 to ƒs /2, where the bandwidth of each terminal node l is given in equation 4 and ƒs is the sampling frequency [17]:
In pattern recognition system, several types of features can be extracted from Wavelet decomposition. The sub-band energy and the coefficients themselves are among the most commonly used in BCI systems [13, 17, 22, 23]. The energy in each terminal node of a WPD tree can be calculated using equation 5.
Where l is the number of the terminal node, j is the level of decomposition and n the index of the coefficient. If the sum of all sub bands energies is calculated by equation 6, then the normalized energy for every sub-band can be defined by equation 7 [23].
In EEG signals, several frequency bands can be associated with specific activity. This bands are: Delta waves (0.5Hz-4Hz), Theta waves (4Hz-7Hz), Alpha waves (8Hz-15Hz), Beta waves (16Hz-31Hz) and Gamma waves (32Hz-42Hz) [14]. According to equation 4, if an EEG signal sampled at 128 Hz is decomposed at level J=4 using WPD, the bandwidth resolution of each terminal node is 4 Hz, which is enough to decompose any EEG signal in the frequency bands mentioned above. With this in mind, 2 of the 3 channels recorded in the dataset where decomposed and the normalized energy was calculated and selected as feature vector, this channels were C3 and C4, because they are spatially the most representative of the electrical activity related to arms movement[13]. The feature vectors extracted from each trial where organized as shown in Figure 5. Eight components where extracted from each channel, for a total of 16 components in the entire feature vector.

3.2- Linear Discriminant Analysis
Linear Discriminant Analysis is a very common technique for dimensionality reduction problems, preprocessing step for machine learning and pattern classification applications. The LDA objective in a two class pattern recognition problem is to project a data matrix X(NxM), where N is the amount data samples of length M, into a lower dimensional space V(Mxk), where k<M. In order to do this a linear transformation (equation 8) is used, this linear transformation maximizes the between-class variance and minimizes the within-class variance, thereby guaranteeing maximum class separability[42, 43].
The first step to find the lower dimensional space V is to calculate the between-class variance matrix SB(MxM). This can be achieved using equation 9, where c is the amount of classes, ni represents the amount of features vectors that belongs to the i class (in this case i
The second step is to calculate the within-class variance matrix SW(MxM) using equation 10, where xij represents i vector of the j class.
Once the SB and SW matrixes are obtained the next step is to calculate the transformation matrix W(MxM) using equation 11. Then from the matrix W, the eigenvalues λ(k) and eigenvectors V(kxM) are calculated and sorted in descended order according to the eigenvalues, selecting only a few k eigenvectors to form the V lower dimensional space. In this work, only one eigenvector was selected, the eigenvector, that provided the best separability between classes when the vectors from the training set where projected into it.
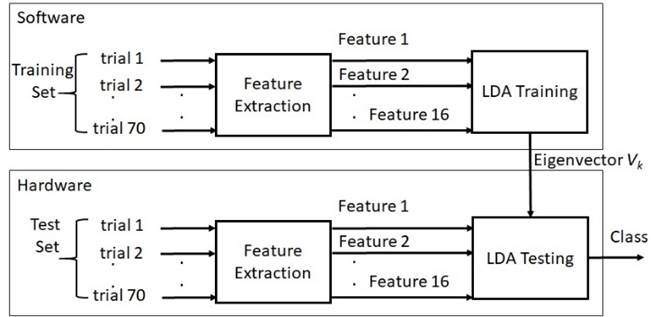
In Figure 6, a better understanding of the two stages of the LDA algorithm is provided, where the first stage is the training of the algorithm. To train the classifier, 70 trials were selected. Then, the software Matlab 2015 from Mathwork Company and its Wavelet toolbox were used to extract the energies features mentioned in section 3.1. The feature vectors were organized into a matrix X(70x16) with 70 features vectors and 16 components in each vector. Once the features were extracted, the between-class variance matrix SB , the within-class variance matrix SW, the transformation matrix W, the eigenvalues λ(k) and eigenvectors V(Mxk) were calculated using Matlab, selecting the eigenvector that provided the best separability between classes, to implement in hardware the validation stage using the equation 8. This second stage of the classifier was implemented on a Zynq 7000 device and validated using the other 70 trials from the test set.
4.- FPGA IMPLEMENTATION.
To implement the proposed system, the tool System Generator from Xilinx was employed, mainly because of its capability to model and implement high-performance DSP systems on FPGA using Simulink, and also its capability to use all the analysis and graphic power from Matlab. Similar to Figure 1, the design in System Generator was divided into several subsystems: Channel Selection, WPD, Sub Band Energy, Control, Register and LDA Classifier, as shown in Figure 7.
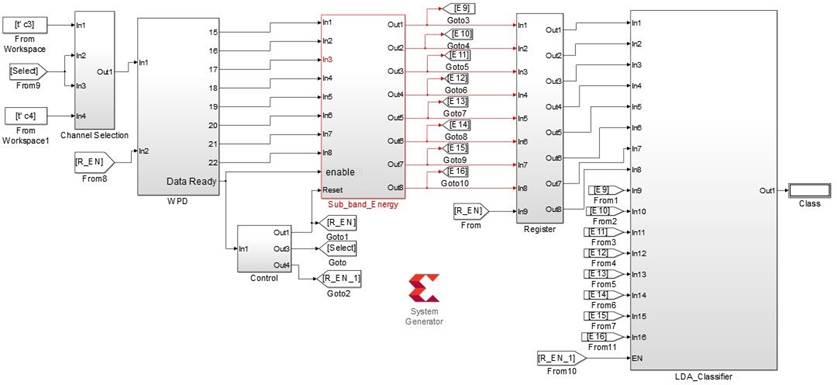
The EEG signals from channels C3 and C4 were loaded from the Matlab Workspace to the Simulink environment using two From Workspace blocks. Then both channels were decomposed up to four levels using Wavelet Packet Decomposition and the normalized energy in the 8 frequency bands mentioned in section 3.1 were used as features for the classifier. However, the two channels were not processed at the same time, because that would require two feature extraction subsystems working simultaneously, incurring on an increase of hardware resources utilization. Instead, an approach similar to the one proposed on [9] was used, where the channels turn to be processed by the feature extraction subsystem is multiplexed. First, the features from the channel C3 are extracted and stored on a register chain and then the features from channel C4 are extracted and introduced to the classifier at the same time as the features from the channel C3. In order to do this, the Channel Selection subsystem receives the samples from both channel at the same time, but it stores the samples that belongs to the channel C4 in a memory, passing to the WPD subsystem the samples from the channel C3 in order to extract the energy features. After the channel C3 features are extracted, the WPD indicates to the Channel Selection subsystem that it is ready to process the samples from C4, using for this communication the signal Select. The signal R EN is used to reset the WPD subsystem to its initial state when the features from the channel C3 are extracted and before the feature extraction from the channel C4 starts, this signal is also used to enable the write operation in the subsystem Register when the features from C3 are in its input. The signal R EN 1 is used to habilitate the operations of the classifier once the features from both channels have been extracted. All of these signals (Select, R EN and R EN 1) emerge from the Control subsystem whose function is to provide order and synchronism to the data transfer between subsystems.
The diagram in Figure 8 shows the internal structure of the Channel Selection subsystem, whose components are a Counter, a RAM Memory, a Multiplexer, a NOT gate and two Gateway in. The inputs 2 and 3 are driven by de Select signal, the input 3 chooses the write or read operation in the RAM Memory that stores the samples from the channel C4, while the input 2 drives the sel signal in the multiplexer that selects which channel samples are passed to the WPD subsystem. A counter with a modulus equal to the amount of samples in the channels C4 and C3 segments is used to drive the address in the memory block. The input 1 is the entry for the samples from the channel C3 and the input 4 is the entry for the samples from the channel C4.

One of the main problems in the design of digital signal processing systems on FPGA is optimizing the use of embedded multipliers on chip[44]. As mentioned in section 3.1 the implementation for the Wavelet Packets Decomposition algorithm is based on a mirror filter bank with two types of filters, a low pass and a high pass filter. These filters’ length and coefficients are dependent on the Mother Wavelet employed, but not all Mother Wavelets have discrete implementation[41]. The Daubechies (Db) family of Wavelets has been used several times in the design of BCI systems [19, 20, 22, 23]. In [17] a comparison of accuracy in a BCI system is performed, when seven different Mother Wavelets are used in a feature extraction algorithm based on the DWT. That comparison shows that the best results were obtain when the Mother Wavelet Daubechies4 (Db4) was employed. That is why Db4 was selected as the Mother Wavelet to be used in this paper. The amount of coefficients for the Db4 is eight per filter. For a parallel FPGA implementation of an eight taps FIR filter, eight multipliers are needed. An alternative implementation for the DWT is presented in [45], where they use distributed arithmetic instead of embedded multiplier to perform the multiplication in the filters. They concluded that the throughput using a conventional embedded multiplier architecture is more than 3 times faster than the throughput achieved when distributed arithmetic is employed, and they report a maximum percent error of 9.8%. Considering that information, a conventional embedded multiplier architecture was selected to be used in this paper. As mentioned above, two filters are required for one level of decomposition with the DWT, incurring in a total of 16 multipliers only in this first stage of decomposition if the mother Wavelet Db4 is used and a parallel architecture is employed. In each decomposition stage, the number of filters doubles in comparison with the previous one, and so it does the number of multipliers. The EEG signals has very low frequency components compared with the oscillators available in most FPGA kits these days. This allows for the use of more hardware efficient filter’s architecture like a serial one, where only one multiplier is used instead of eight, without compromising the system latency.
In a serial architecture for a FIR filter all the multiplications and additions necessary to process one sample need to be completed before the next sample arrives. For an M taps filter, M multiplications and additions are necessary, assuming that one multiplication and one addition can be performed in the same clock cycle, a constrain to the system clock frequency (CLK) needs to be placed. That constrain is that the CLK frequency must be at least M times higher than the sampling frequency of the signal. This relationship is shown in equation 12[44].
To implement the filter the HDL Coder Tool from Matlab was used, generating the VHDL code for a Discrete Time FIR filter block, configured to use a serial architecture. This block is located at the Simulink DSP Library. After the VHDL code of the low pass and high pass filters was generated, the code of each filter was introduced into a Black Box of System Generator. These black boxes alone with the other element shown in Figure 9 conform the basic decomposition block for the WPD implementation proposed in this paper.
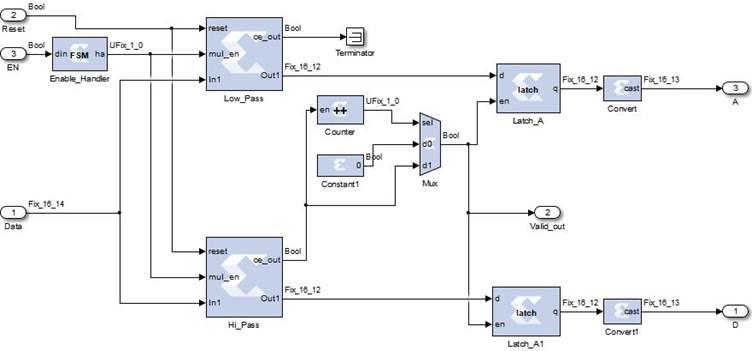
Other blocks shown in Figure 9 are a counter, a multiplexer and a couple of latches, which together provide the equivalent of a down-sample block. The counter has only one bit in the output port, which means that the output can only be zero or one. The enable port of the counter is connected to the ce_out port of the Hi_Pass filter which indicates when a new sample is ready at the output of the filter (it also could be connected to the Low_Pass filter). This makes the counter output be one for one sampling period and zero for the next one, which makes the output of the multiplexer delivers the ce_out signal pulse every two sampling periods to the enable input of the latches. In this way, it achieves the same results as a down-sample by a factor of 2. The input of the FSM (Finite State Machine) block is connected to the valid_out pin of the previous stage, which indicates when a new sample is presented at the output of that stage. When the FSM block detects a rising edge in the din port, it sets the output ha to high for as many clock periods as the filter’s coefficients, according to the relationship shown in equation 12, allowing the filter to perform all the necessary operations to process one sample. Last but not least, the Convert blocks are used to accommodate the fixed-point representation of the samples to a 16-bit sign format before they enter the next stage of the system.
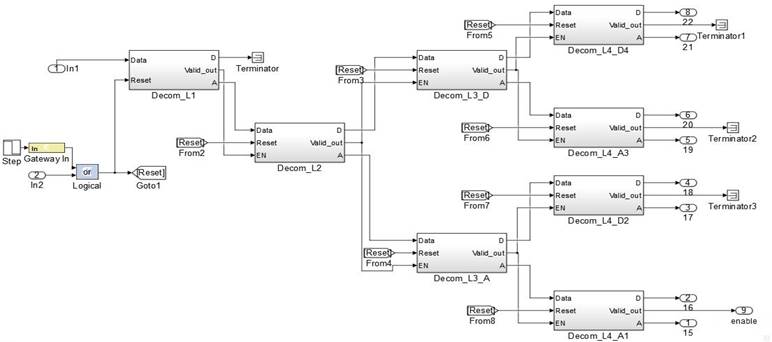
With this basic decomposition block, any signal can be decomposed in as many levels as necessary, simply by concatenating several of them. The entire decomposition tree for four levels of WPD is shown in Figure 10. For a signal sampled at 128 Hz, this tree covers the frequency range from 0 to 64 Hz. However, the information of interest (0-32Hz) is concentrated in the eight terminal nodes of the left. This means that in the hardware implementation the eight terminal nodes of the right and the previous nodes that lead to them are not necessary, allowing an optimization in the use of hardware resources. Thanks to the modular approach proposed in this paper for the implementation of the WPD algorithm, there is no need to implement the entire tree, only the left half that covers the frequencies of interest. This implementation is performed using several blocks that implement the design shown in figure 9. The interconnection of these blocks within the WPD subsystem is shown in Figure 11.

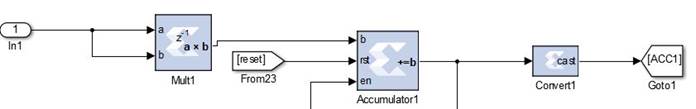
The energy in each band is the sum of the square of the coefficient on that band. To normalize that energy, it needs to be divided between the sums of the energy in all bands. These operations are performed by the Sub Band Energy subsystem, which receives the coefficients from each terminal node in the WPD subsystem. Each terminal node that enters the Sub Band Energy subsystem is connected to a multiplier and that multiplier is connected to an accumulator, as shown in Figure 12. This structure performs the operation of equation 5.
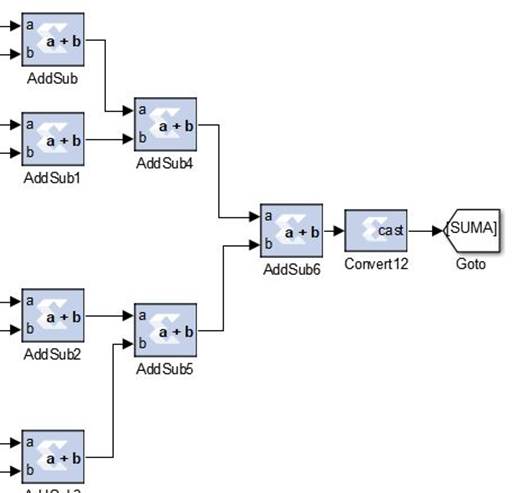
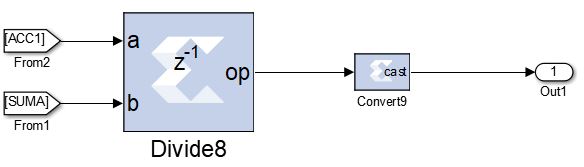
The enable of the accumulators is connected to the Valid out port in one of the basic decomposition blocks of the final stage in the WPD subsystem, which indicates when a new coefficient is ready. The output of all accumulators is added with the adders shown in Figure 13, to perform the operation of equation 6. That sum is then passed as the dividend to a divide block whose divisor is the output of the accumulator. The division that normalizes the energy (equation 7) of the terminal node 15 is shown in Figure 14. This procedure is performed to all the terminal nodes that enter the Sub Band Energy subsystem.
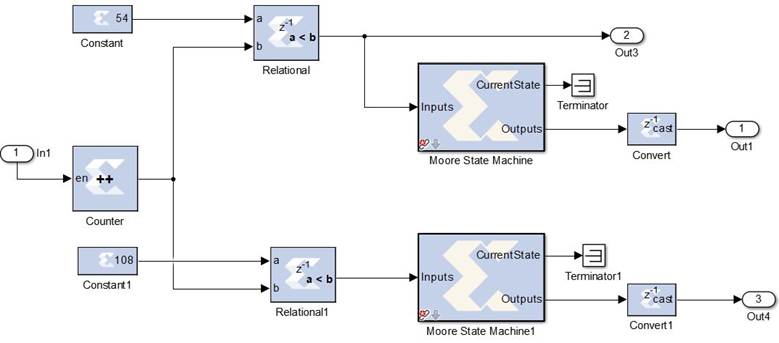
In order to extract the features from one channel first, and the from the second, and pass both at the same time to the classifier, it is necessary to have a synchronism in the data transfer between subsystems. This is provided by the control subsystem, whose internal structure is shown in Figure 15. In this subsystem, a counter with the enable connected to the Valid out port in one of the basic decomposition blocks of the final stage in the WPD subsystem, indicates how many Wavelet coefficients have been calculated. The output from the counter is compared with the number of coefficients needed from channel C3 using a Relational block. Then the output of that block is used as the Select signal and as the input of a Moore State Machine that performs the function of an edge detector. That state machine generates a pulse in high that is used as the R_EN signal. After the R_EN signal resets the WPD and Sub Band Energy subsystems, indicating the end of the feature extraction from C3, the same operation needs to be performed for C4. Therefore, the same procedure is applied with a second Relational block and a second Moore State Machine. But since the counter is not reset, the comparison in the second Relational block is performed with a constant that is twice the number of coefficients needed in the first one. The exit of the second state machine is used as the R_EN_1 signal.
The final subsystem, LDA Classifier assigns a class (1 or 2) to the feature vector extracted from the EEG signals. This is done by implementing equation 8 that was defined as the projection of the data X (feature vector) on a lower dimensional space V k. In simpler words, this means calculating the dot product between the feature vector and the eigenvector selected, which results in a scalar number. At the time of the eigenvector selection, the feature vectors extracted from the training trials belonging to both classes are multiplied by it and a threshold for the decision between classes is set. During the validation stage, if the multiplication of a feature vector that belongs to the test set with the eigenvector is above that threshold, then class 1 is assigned. If not, class 2 is chosen. The details of the LDA Classifier subsystem implementation are shown in Figure 16.

The internal structure of the LDA Classifier subsystem can be separated into four main operations for a better understanding:
In the Eigenvector Component Selection, the eigenvector values are stored in a ROM memory block (implemented with a RAM memory), whose address is controlled by a counter with modulus 16. A register connected to the edge signal, which is connected to the R_EN_1 signal, controls the enable of the ROM memory and the counter. When a pulse is received in the edge signal, it enables the transition in the register whose outputs enable the Counter and the ROM memory, commencing this way the operation of the classifier.
The Multiplexer sel signal is driven by the same counter as the ROM block that storage the eigenvalues. Thus, during the same 16 clock periods that the ROM block outputs the components of the eigenvector, the multiplexer will output the component of the feature vector.
The Dot Product Calculation section is based mainly in a multiplier that calculates the product between the feature vector and the eigenvector. An accumulator is used to storage the sum of these products and a register is used to save the result.
The final section is the Class Assignment, whose task is to compare the result of the dot product with the threshold established during the training stage and to assign a class to the vector. To do this, it uses a Constant block to store the threshold, a Relational block to make the comparison and a multiplexer whose sel signal is driven by the result of the comparison. Several delays are used to synchronize the enable signal of the comparison block.
5- RESULTS AND DISCUSSION
To analyze the performance during the classification of both classes, statistical tools like Confusion matrix (Figure 17) and Receiver Operational Characteristic (ROC curve) shown in Figure 18 were used. The Confusion matrix shows the accuracy in the classification of each class and the total classification accuracy of the system, while the ROC curves shows a graphic of true positive rate versus false positive rate for each class.

In Figure 17, the confusion matrix shows several accuracy results for the classification of two classes, to class 1 the label P (Positive) was assigned and to class 2 the label N (Negative) was assigned. The first column in this matrix shows the classification results for the features vectors that truly belong to the positive class, obtaining 34 true positives and 6 false positives, resulting in a sensitivity of 85%. The second column shows the classification results for the feature vectors that truly belong to the negative class, resulting in 22 true negatives and 8 false negatives, for a specificity of 73.3%. The first component in the third column indicates the correct classification rate for the vectors assigned to the positive class for an 81% of correct classification, while the second component in the third column offers the same information but for the feature vectors assigned to the negative class, resulting in a 78.6% of correct classification. The third component in this third column indicates the total correct classification rate of all the features vectors, where 80% of the 70 feature vectors extracted from the test set were correctly classified. The percent value below true positives, false negative, true negatives and false negative number indicates the percentage that those vectors represents out of the 70 features vectors in the test set.
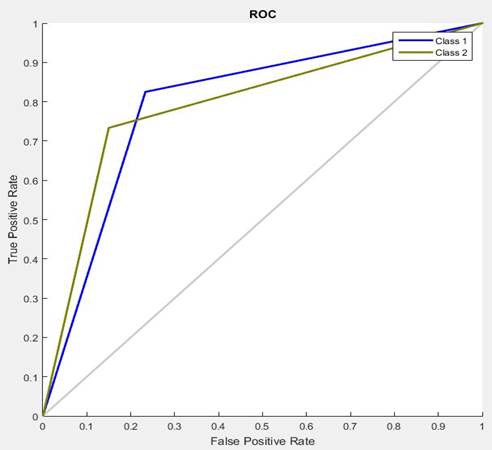
As mentioned above, the ROC curve is a plot of the true positive rate on the vertical axis, against the false positive rate on the horizontal axis for both classes. In other words, it is a plot of the probability of correct classification against the probability of false classification, where the closer the curves pass to the upper left corner, the better the classifier is. Another parameter call Area Under Curve (AUC) can be estimated from the ROC curves. This parameter provides a single numeric value obtained from each class curve, for the evaluation of the performance of the classifier during the classification of that class. The closer this parameter is to 1, the better the classifier is. For the curve of class 1, the AUC is 0.7985 and for the curve of class 2 it is 0.7925.
Another important metric for evaluating the classification performance of a BCI system is the Information Transfer Rate (ITR) [36 ] which can be expressed by equation 13.
Where L is the number of decisions per minute, and pS the accuracy of the decision made for the Nt targets. As mentioned above only the last six seconds were used from each trial, so in a minute ten trials can be processed which make L=10. The total accuracy of the system is ps=0.8 and the number of targets Nt is the amount of classes to classified. Because of the relatively long EEG segments (6 seconds) used to classified only two classes, the ITR achieved was only of 2.78 bit/min.
The system was implemented using Hardware/Software Co-Simulation on a Zybo platform, whose main component is a Zynq xc7z010-clg400. Also the latency and power consumption were estimated using the Xilinx tools provided by Vivado Design Suit. In Table 1, an implementation report and comparison with previous works is shown for a clock frequency of 1.5 MHz. Although the maximum operating frequency of the system is 61.234 MHz, the clock frequency was reduced to obtain a lower power consumption. The comparison shows an improvement in latency with other similar systems, while maintaining almost the same accuracy as [30], a better one than [33] and been outperformed only by [36]. In addition, the consumption of LUTs (Look Up Tables) and LUTRAM (Look Up Table Random Access Memory) is less than the three previous analyzed works and the only design that outperforms this work in the use of DSP block was [33], at the cost of incurring on a latency of 500 ms. Is also worth mentioned that design proposed in this paper use only two EEG channels, instead of 14 or 22 like the ones compared with. Still, a similar accuracy is maintained, and lower use in hardware resources and latency are achieved. All of this thanks to the use of the WPD algorithm to extract relevant features from the EEG signals.
6- CONCLUSIONS
In this work, a System Generator model for a hardware efficient BCI was designed, using WPD as the feature extraction algorithm and LDA as the classifier. The design was validated using real EEG signals representative of two motor imagery actions (right hand movement and left hand movement), recorded during the event BCI Competition 2003. An accuracy of 80 % was achieved in the classification process, performed during the validation stage of the system on a Zynq xc7z010-clg400 device, using Hardware/Software Co-Simulation. Other metrics like ROC curves and Information Transfer Rate of the system was analyzed while the latency, hardware resource consumption and power consumption was compared with previous works, showing an improvement in the resource consumption and the latency while maintaining an average accuracy. The results obtained, proved that the design proposed in this paper can be used to accelerate the more complex computational stages in embedded BCIs systems, due to its implementation on FPGA. Future work will include the incorporation of a data acquisition hardware, a preprocessing module and a feedback stage for the online experimentation on test subjects.

