


 Custom services
 Spanish (pdf)
 Article in xml format
 Article references
 Send this article by e-mail
 Cited by SciELO
  Similars in
SciELO
Similars in
SciELO 
 Permalink
Introduction
Pipe bursts are a significant problem for a large number of Water Distribution Systems in the world. More than 32 billion cubic meters of water are lost within the distribution systems, which accounts for 35% of the total water supply across the world [1]. Although the main affectation lies in the water losses, pipe breaks can also result in damage to surrounding infrastructure, posing severe threats to public security [2, 3]. Large bursts remain unobserved in many cases for a long duration before they are identified [4, 5], thus, quick detection of the burst would allow decision-makers to reduce the impact of such effects to significant values.
In general, two big approaches have been used in the literature to detect bursts: model-based and data-driven approach [6, 7]. The main inconvenience that arises with model-based methods lies in the need for well-calibrated hydraulic modeling of the network, which is not an extended practice among water supply companies [8]. In addition, they depend on water supply systems that work 24 hours a day, which could not be the case for several systems. On the other hand, data-driven methods have found great applicability in real-life District Metered Areas (DMA), mainly because they do not need detailed knowledge about the pipe network parameters or system layout [9], thus, they are considered to be promising tools to detect pipe bursts [10].
Many of the existing approaches rely on data from several sensors to extract features, however, in real-life water distribution systems, many DMAs are isolated from each other, and only flow (or water demand) is monitored in the single inlet [11]. Automatic detection of bursts is desired, since it would allow the reduction in time of discovery, thus reducing the total amount of wasted water.
Several efforts have been made recently to develop effective algorithms to automatically detect bursts in water pipes using data-driven approaches. The work presented in [10] focuses on the combined use of multiple data features at multiple continuous time steps to identify burst events based on the prediction-classification concept.
In [12], authors propose an automatic water pipeline leak detection device to continuously monitor the water pipelines to reduce manpower involvement. The designed system allows detecting leaks and sending a notification to assist in-place and fix damages. The mechanism employed in this work to detect leaks is the Fourier Transform, which comes with the disadvantage that it does not offer a multi-resolution analysis [13].
In [14] authors developed an algorithm for automatic detection and localization of bursts employing the Discrete Wavelet Transform (DWT) and the cross-correlation. Authors prove that the Coiflet 1 is the most adequate Wavelet function to detect the singularity generated by bursts. It is also shown how usage of the Wavelet Correlation Criterion (CCW) offers a cleaner spectrum of the signal that makes simpler the detection of bursts. The results obtained in that work were improved in [15] by minimizing the size of bursts that can be detected and the probability of false positives, using a similar approach. Both works are, at this moment, the only ones that perform automatic detection of bursts. Although some other authors have proposed techniques that use transient pressure signals to detect and localize bursts in pipelines, the existing techniques require offline processing that can delay the detection of bursts [16].
As it is observed, most works on burst detection are not conceived to perform the algorithms on small, processing capability-constrained, low-power embedded systems. Instead, they rely on computer devices with the processing capability to perform high-complexity algorithms. In practical scenarios, low energy consumption is of particular importance for pressure-based leak detection where the optimal, most sensitive sensor positions are often located in the periphery of a water distribution system, where no external power source is available and energy harvesting might not be a viable option [17]. In addition, applications that favor more local computations and less wireless-transmission time can contribute to solving the problem of high power consumption and performance issues plaguing most centralized Wireless Sensor Network applications [18]. This constraint shows the need for data logger nodes that do most of the processing locally while keeping a low-power regime.
Microcontrollers are among the platforms that have been more widely used as low-power sensor nodes since they can perform multiple tasks while guaranteeing low power consumption. The energy savings typically come at the expense of a reduced processing capacity, however, several efforts have been made to perform very complex tasks of digital signal processing, such as a Wavelet Transform, in microcontrollers. In [19] authors present an implementation of a Haar Wavelet Transform [20] using an integer optimization on an MSP430F169 microcontroller from Texas Instruments. The fact of having to use the Central Processing Unit (CPU) all time to implement the Wavelet Transform is an inconvenience since the CPU is the main source of energy consumption in microcontrollers and low-power strategies are addressed to reduce the CPU’s active mode time. In [21], authors employ an MSP430FR5969 microcontroller to implement a four-level Wavelet Transform. As stated by authors, the Wavelet transformation, compression, and storage process occurs in 0.920 s, which could be a shortcoming for applications where higher sampling frequencies are needed, as is the case for burst detection in water pipes (200 Hz-400 Hz [14, 22, 23]).
The current work uses the approach of detecting bursts with a single sensor, by matching a pattern that is different from normal operation [11]. The desired pattern is the burst, which can be treated as a singularity, thus, a singularity enhancement algorithm is employed, such as the one used in [14, 15]. The goal of the current work is to design an algorithm to detect bursts in water pipes, focused on reducing its computational complexity while maintaining a high probability of detection and a low probability of false positives.
The main contributions of the paper are:
A new algorithm to be implemented in a low-power embedded device for automatic detection of bursts in water pipes in-place.
A comparison in performance of two implementations of the convolution operation within the MSP430FR5994’s LEA module is given.
The algorithm’s implementation achieves a 100% detection probability and a 0.13% false positive probability for a burst flow rate around 4.2% of the main flow rate, while maintaining a low power consumption.
Automatic burst detection in water pipe
In [14] authors present the first algorithm to detect and locate bursts. The same authors present a work [15] improving the resolution about the singularity generated by a burst through the connection of the Lipschitz exponent with the Wavelet Correlation Criterion. In both works, authors use the same approach of finding a DWT-based coefficient, that enhances the singularity generated by bursts. As far as we know, this approach remains the only one that is capable of detecting bursts in water pipes automatically for isolated nodes, for this reason, the current work uses a similar approach.
The algorithm presented in [14] is based on using the DWT to detect the negative pressure wave that is produced when a burst occurs. The detail coefficients of the last two decomposition levels are extracted and their cross-correlation is found. These coefficients are then compared with a previously determined threshold to indicate the occurrence of a burst. The threshold is found in a pre-processing stage from a prefixed false positive probability. Pressure signals are obtained through several pressure sensors placed on different points of the pipe, connected to their respective Analog-to-Digital Converters (ADC), which return the digital signal  using uniform sampling. The DWT is applied to the discrete signal using the algorithm of cascaded discrete convolutions [24, 25]. On each decomposition level the signal’s convolution with the filters
  and
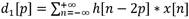
and  , low-pass and high-pass respectively, are determined; the vector resulting from this operation represents the approximation and detail coefficients. Each Wavelet function has different filters, for the work presented in [14], the Coiflet 1 Wavelet function was used. For the first decomposition level, the approximation and detail coefficients, a1 and d1 respectively, are calculated as shown in Equation (1) and (2).
 (1)
(1)
 (2)
(2)
For the ith decomposition level, the approximation and detail coefficients are determined as shown in Equation (3) and (4).
 (3)
(3)
 (4)
(4)
The CCW must be determined through the element-wise multiplication of the detail coefficients of two consecutive decomposition levels [14]. This operation is performed as shown in Equation (5).
 (5)
(5)
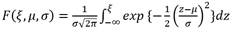
where Ci represents the coefficients of the CCW at level i. The detection threshold is determined using a Gaussian distribution, based on the Central Limit Theorem [26].
The equation that relates the detection threshold ( for a fixed false positive probability is determined as shown in Equation (6).
 (6)
(6)
where Q-1 is the complementary distribution function from the standard Gaussian distribution, Pfp is the false positive probability and N is the number of samples.
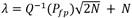
In [15], authors find the detection threshold after assuming that coefficients for the detection criterion follow a normal distribution. With that assumption, the threshold can be obtained for a fixed probability of false positives, aided by the existing tables for the normalized case or through Equation (7) [15].
 (7)
(7)
The statistical decision v used to compare with the threshold ( is determined as shown Equation (8) [14].
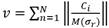 (8)
(8)
where M((r) is the mode of the pressure signal’s standard deviation when no burst is present. The statistical decision ( to compare with the threshold ( is shown in Equation (9) [15].
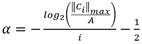 (9)
(9)
where A > 0.
Digital signal processing in low power platforms
As can be concluded from the previous section, when implementing an algorithm of that complexity in a low-power embedded device, three aspects must be attended to: determination of CCW, the denoising, and the usage of probability distributions to find the detection threshold.
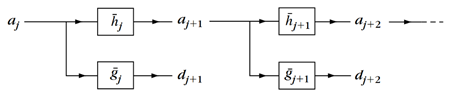
As explained in Section 2, detail coefficients of the last two decomposition levels are needed to determine the CCW. One of the most used schemes to find the DWT is the Mallat scheme [24], as can be seen in Fig. 1, it allows to determine the Wavelet coefficients through a filter bank. From this scheme, it can be concluded that N+1 operations of convolution and downsampling are needed to determine the detail coefficients of the last two decomposition levels. If instead of the detail coefficients, the approximation coefficients are taken, the number of convolution and downsampling operations would be reduced by one, which would contribute to the reduction in power consumption.
In addition, usage of approximation coefficients allows attenuating the high-level noise at the same time that the coefficients for the CCW are found. In [14] the coefficients resulting from the DWT are denoised using the Wavelet Shrinkage algorithm [27] with the Visushrink strategy [28]. As can be concluded from [28], this strategy requires the usage of transcendental functions such as the exponential function and the logarithmic function, whose implementations would be very expensive in terms of CPU and memory when using low-power embedded devices. The noise that is present in the acquired signals is high-frequency noise relative to the variations of the pressure signal when a burst occurs; therefore, when using the approximation coefficients, a filtered version of the burst signal is already obtained.
The other aspect that must be attended to when implementing an algorithm of this complexity is the usage of probability distributions to find the detection threshold. An implementation of this kind of algorithm in low-power embedded devices would consume most of the controller’s resources and some operations might even be impossible to implement. For this reason, a new and less complex strategy was used to decide on the detection of a burst. The determination of a single probabilistic threshold was changed by two parameters with low processing requirements that apply simple comparison decisions. The analysis was restricted to check the magnitude of the CCW and the number of significant coefficients. To make a better distinction of the singularities generated by bursts, the CCW is extracted to the difference of the signal with its mean, which allows working with several low-magnitude coefficients that can be zeroed out by only performing a right-shifting in the analysis of significant CCW coefficients.
Experimental Set-Up
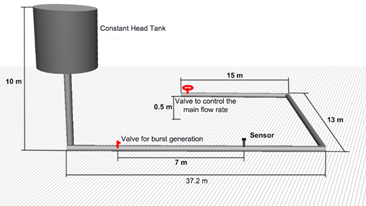
All signals used in this work were acquired on the laboratory of the Center for Hydraulic Research from the Technological University of Havana José Antonio Echeverría, Cujae. The installation has a 160 mm High-Density Polyethylene pipeline, which is 65.2 m long. The pipeline is supplied by a constant head tank that guarantees a pressure of 10 mwc at the input of the pipeline. At the end of the pipeline, there is a valve that is regulated to guarantee a mean fluid velocity of 2 m/s, this was set as the extreme condition where the bigger noise is generated, thus, the burst detection is more difficult. Bursts with a flow rate of 4.2% relative to the main flow rate, were manually induced by opening a small ball valve. The pressure sensor is placed at 7 m from the burst location. A scheme of the installation is shown in Fig. 2.
Implementation of proposed algorithm
The proposed algorithm is divided into two stages: signal features extraction and signal features processing. The former stage aims at extracting a set of coefficients that identifies bursts in water pipes. The second stage processes the extracted features by applying two different operations and comparing them with the corresponding threshold.
Signal features extraction
The focus of the algorithm proposed in the current work is the extraction of a set of coefficients, based on the Wavelet Transform, that allows distinguishing a burst from noise in water pipes. As a first step, the analysis window size must be chosen, as well as the Wavelet function. Samples are acquired at 400 Hz.
The DWT is the most CPU-intensive operation on the proposed algorithm, for this reason, a very efficient implementation is needed. As it was explained in Section 3, the DWT can be found with a filter bank, and each of the filtering steps can be implemented in two manners: convolution in the time domain or through the Fourier Transform. For this kind of operation, the FR family of MSP430 microcontrollers from Texas Instruments includes the Low Energy Accelerator (LEA) module [29].
The LEA module is a low-power co-processor that is capable of performing signal processing operations without intervention from the CPU and triggering an interrupt when the operation is finished. It is capable of implementing digital filtering such as finite impulse response (FIR) and infinite impulse response (IIR) filters, as well as Fast Fourier Transform (FFT) operation. The LEA module exchanges data with the CPU through a shared Random Access Memory (RAM) space which can be used when the LEA module indicates that results are ready to be used. With this mechanism, the CPU can remain in a deep sleep mode while the LEA module is processing data, thus reducing energy consumption. In Fig. 1 it can be observed that each decomposition level in a Wavelet Transform includes two FIR filtering operations and two downsampling operations. Both, downsampling and FIR filtering, are operations included in the “MSP-DSPLIB Digital Signal Processing Library for MSP430 Microcontrollers”, which is optimized by the manufacturers to handle the LEA module.
A comparative analysis for different window sizes when performing a convolution using the LEA module, is made to determine the best choice in execution time between both methods. Tests results are shown in Fig. 3. For each method four different signal sizes were evaluated, from 32 samples to 256 samples, taking the power-of-two values to be consistent with the restrictions of the LEA module. To get a better resolution in convolution, the acquired samples are left-justified at the ADC’s output. As can be observed, for all signal sizes, the time convolution method performed better, since it employs less time to finish the operation. The time convolution method performed 65.3% faster on average than the FFT method for all window sizes. This justifies the choice of the time convolution method to perform the FIR filtering on the DWT implementation.
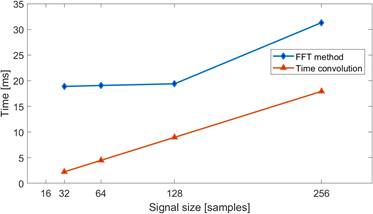
Fig. 3 Performance comparison of convolution in MSP430’s LEA module between convolution in the time domain or through the Fourier Transform.
The Coiflet 1 was chosen as the Wavelet function to detect bursts, following the results presented in [14]. The study presents an analysis of applying the DWT to a burst signal with several Wavelet functions. After finding all the DWT vectors, the Lipschitz coefficient was determined for each one of them and the Coiflet 1 returned the smallest value, which means that it offers the best refinement to the singularity, when compared with the others. The signal’s DWT gives the spread representation, which is a small set of coefficients that holds the main features of the signal. Burst signals can be detected using this set of coefficients. Usage of correlation criterion with the Wavelet coefficients to highlight singularities is shown in [14]. The CCW is defined as the element-wise multiplication of Wavelet coefficients for two consecutive decomposition levels. For a signal x of length 𝑁, the CCW for level k can be determined as shown in Equation (10).
 (10)
(10)
where  ,
,  is the operation of extracting the detail coefficients from decomposition level k.
In [14] authors calculate the CCW using the detail coefficients. As indicated in Section 3, some modifications were made to the original algorithm to adapt it to the processing constraints of a low-power controller, such as the determination of the CCW to the difference between the signal and its mean, and the usage of approximation coefficients (instead of detail coefficients) for the first two decomposition levels. With these changes, the CCW, based on the approximation coefficients, for a signal x of length N, is defined as shown in Equation (11).
 (11)
(11)
where ,
,  is the operation of extracting the approximation coefficients from decomposition level k. The Equation (12) is used as a simplified notation to represent the absolute value of the resulting signal from obtaining the level two, modified CCW, to the ith window of the signal x (discrete and length N) removing its mean value.
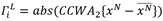 (12)
(12)
where L is the length of the resulting signal, with L < N.
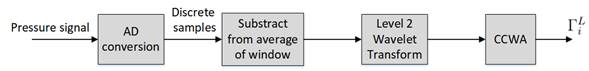
These  coefficients resulting from the CCWA are then used in a second stage to detect the burst. The global steps in the signal features extraction stage are shown in Fig. 4.

Signal features processing
For the gamma vector () to work as an effective enhancer of burst events, the choice of the input signal’s analysis windows size should be made. As can be seen in Fig. 5, 6, 7 and 8, as the windows size increases, the gamma values’ magnitude is increased, thus, it is simpler to distinguish a burst from noise. However, choosing a very long analysis window demands more resources from the processor, and it takes longer to finish processing signals. Limitations on available RAM in low-power microcontrollers impose the need of reducing the amount of memory used. In this case, the windows size of 64 samples was chosen, since, as can be observed, it is the smallest window size that distinguishes well the frames where a burst is present and those where only the noise is present. Since the proposed algorithm reduces the number of decomposition levels and uses approximation coefficients, some non-burst related, high-frequency components, are obtained in the gamma vector with a magnitude that could increase the false positive probability. To compensate for this effect, instead of limiting the detection of a burst to choosing gamma values over a certain threshold, as it was made in [14,15], the number of significant gamma values per analysis windows is included in addition to the magnitude. The lower magnitude bound of what is identified as “significant gamma values” was fixed in the minimum Q15-formatted value after left justification by the ADC, it was denoted as LS
ADC
= 24 * 2+15 0 = 0.00048828125. In this case, the MSP430FR5994 microcontroller’s ADC outputs results with a 12-bit maximum resolution and it offers the choice of giving conversion results, automatically, left-justified or right-justified within a 16-bit register.

Fig. 5 Superposition of Gamma vector and its corresponding burst signal for an analysis windows size of 32 samples.

Fig. 6 Superposition of Gamma vector and its corresponding burst signal for an analysis windows size of 64 samples
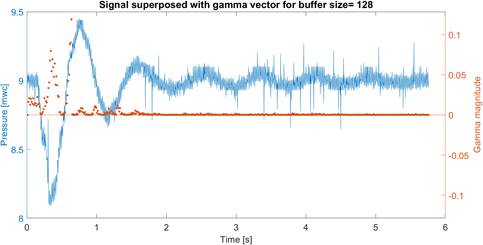
Fig. 7 Superposition of Gamma vector and its corresponding burst signal for an analysis windows size of 128 samples.

Fig. 8 Superposition of Gamma vector and its corresponding burst signal for an analysis windows size of 256 samples.
In the sharp rise and fall slopes, the sum of gamma values is expected to be high, as well as the number of gamma values over LS ADC , when compared to noise signals. Both magnitudes were identified as ( (for the sum of gamma values) and ( (for the number of gamma values over LS ADC ).
Parameters 𝛼 and ( for the 𝑖𝑡ℎ window are defined as shown in Equation (13) and (14).
 (13)
(13)
 (14)
(14)
Transformations and on a discrete and finite signal f, of length L, are defined as shown in Equation (15) and (16).
 (15)
(15)
 (16)
(16)
A comparison of the behavior of 𝛼 and ( parameters for a signal with a burst and only noise is shown in Fig. 9 and 10. In noise signals, alpha parameter remains in a low magnitude and little variance; in the case of beta parameters, the difference in the magnitude of their variance could be more significant when compared to the behavior of bursts, still, it can be noticed that the maximum value remains low in most cases. For these reasons, it was decided to calculate the thresholds for 𝛼 and ( as shown in Equation (17) and (18), guaranteeing that only noise is present at the moment of threshold determination. This choice of threshold calculation allows keeping a balance to raise the detection probability while reducing the false positive probability. The threshold for (, which is the first condition to check, is more permissive, however, the threshold for ( is more strict, that way, even if some non-burst signals pass the ( threshold, it is more difficult to pass the ( threshold.
 (17)
(17)
 (18)
(18)

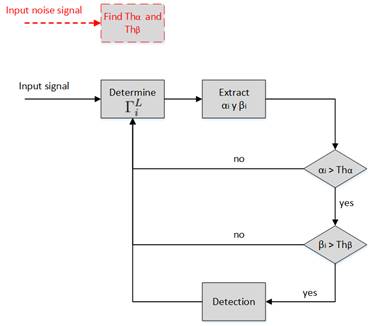
After determining all parameters, the block diagram of the algorithm to detect bursts is shown in Fig. 11. The thresholds determination stage was highlighted in dotted red lines to distinguish it from the main process, since Th ( and Th ( are determined in an initial stage, when the node is installed, guaranteeing that no burst occurs at that moment. Once the node finishes the threshold determination stage, it starts executing the burst detection algorithm.

Analysis of algorithm’s performance
In this section, the performance of the proposed algorithm is assessed, by determining its detection probability and false positives probability. Tests were performed in the installation described in Section 4, shown in Fig. 2. A total of 60 bursts were generated and processed to get the detection probability. False positives probability was determined through the analysis of 2269 windows containing only noise.
Algorithm’s detection probability analysis
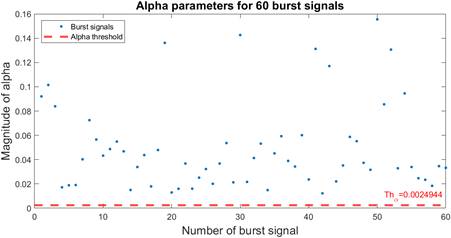
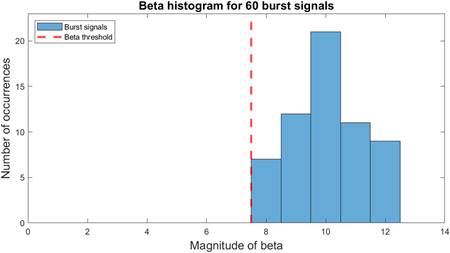
For all signals where a burst is detected, alpha and beta parameters are extracted for the first analysis window where the detection is achieved. In case no burst is detected for any of the studied signals, alpha and beta parameters are extracted for the window where alpha reaches its highest value. Results are shown in Fig. 12 and Fig. 13. As can be observed all of the tested signals matched the detection criteria, for a detection probability of 100%. From Fig. 13 it can be concluded that more than a third of the analyzed signals reached a beta value of 10, which implies that for those analysis windows, the number of gamma values over LS ADC outnumbered the threshold (Th ( ) in three. This is a remarkable difference, since Th ( is determined for the maximum number of gamma values over LS ADC , for the noise signals used for training, therefore, it means that the most frequent ( value, for the analyzed burst signals, exceeds the maximum ( value determined for noise signals approximately in a 43.86% of its value.
In addition, the algorithm was tested on the same burst signals set used in [15]. In that work, the author focuses on analyzing three different burst flow rates. Results concluded that it performed very well for flow rates of 2.2% and 4.2% from the main flow rate, however, for a flow rate of 1.4% the detection probability started to decrease. After analyzing the same set of samples with the algorithm presented in our work, the results are shown in Table 1. As can be seen, our algorithm detects 100% of bursts with the biggest flow rate, the main difference lies in the burst flow rate of 2.2% relative to the main flow rate, for that case the detection probability falls to 76.67%, compared to a 100% detection probability shown in [15]. Although the performance falls for this burst flow rate, the algorithm remains a robust solution for low-power embedded devices in burst flow rates close to 4.2% (or bigger) of the main flow rate.
Algorithm’s false positive probability analysis
To find the false positives probability, for all analyzed windows of noise signals, alpha and beta parameters were extracted. Results are shown in Fig. 14 and 15. As can be observed, only three out of the 2269 noise windows under analysis indicated, erroneously, the occurrence of a burst, for a false positive probability of 0.13%. From both figures, it can be observed that, even when a large number of windows had an alpha parameter over the threshold (Th ( ), most of those cases didn't match the second detection criteria, which gave the algorithm more robustness to false positives. In addition, from Fig.15 it is noticeable that more than half the total of analyzed windows, presented only one or none gamma value over LS ADC , and as the possible beta values increase, there is a lesser number of occurrences. This behavior for noise signals is very different from the one observed for burst signals in Fig. 13, which confirms that the usage of alpha and beta parameters, presented in this work, are good as estimators of bursts' presence.
As it was made in Section 6.1, noise samples used in [15] were analyzed with our algorithm and a false positive probability of 0.21% was obtained. As can be seen, although some analysis windows were detected erroneously as bursts, the false positive probability remains very low.


Conclusions
The strategy of choosing the approximation coefficients for the CCW, multiple simple thresholds instead of a single complex one, left justification for the ADC and finding the CCW to the difference of the signal with its mean, allowed the implementation of an algorithm for automatic detection of bursts in water pipes in low-power embedded systems while maintaining a good performance.
The comparison between time convolution and FFT methods, using the MSP430FR5994 microcontroller’s LEA module to perform the convolution operation, resulted in the conclusion that the time convolution method is more efficient for signal sizes between 32 and 256 samples. For all signal sizes in the range, execution time is reduced by an average of 65.3% relative to the execution time of the FFT-based method, which has implications in lowering the DWT’s power consumption.
Tests performed at a sample rate of 400 Hz and a burst flow rate of 4.2% of the main flow rate, gave as result a detection probability of 100% for the 60 burst signals analyzed and a false positive probability of 0.13% for 2269 noise-only windows.
The algorithm was compared to an implementation using a similar approach but with higher processing requirements and results showed that, although the detection probability reduces as bursts’ flow rate reduces, for flow rates close to 4.2% of the main flow rate, it exhibits a similar behavior.
As future work, new algorithms will be implemented in the microcontroller, using results from an Artificial Intelligence-based analysis, and this approach will be compared with the current work to check differences in energy consumption.

