


My SciELO
 Custom services
Services on Demand
Journal

Article
 text in
  English (pdf)
 Article in xml format
 Article references
 Send this article by e-mail
Indicators
-
 Cited by SciELO
Related links
-
 Similars in
SciELO
Similars in
SciELO
Share

 Permalink
Anales de la Academia de Ciencias de Cuba
On-line version ISSN 2304-0106
Anales de la ACC vol.12 no.3 La Habana Sept.-Dec. 2022 Epub Sep 28, 2022
Original Research Article
Contributions of epidemiology, modelling, and information systems to the COVID-19 response
1
6
*
 http://orcid.org/0000-0002-5350-657X
2
http://orcid.org/0000-0001-7747-1052
3
http://orcid.org/0000-0002-0293-5999
4
http://orcid.org/0000-0002-2231-0822
5
http://orcid.org/0000-0002-2345-1387
5
http://orcid.org/0000-0001-9786-0872
5
http://orcid.org/0000-0001-7702-6063
1
http://orcid.org/0000-0001-9231-7109
5
http://orcid.org/0000-0003-1189-6773
5
http://orcid.org/0000-0001-6015-4261
1 Instituto de Medicina Tropical Pedro Kourí. La Habana, Cuba
2 Centro de Inmunología Molecular. La Habana, Cuba
3 Escuela Nacional de Salud Pública. La Habana, Cuba
4 Instituto de Higiene y Microbiología. La Habana, Cuba
5 Universidad de La Habana. La Habana, Cuba
6 Titular de la Academia de Ciencias de Cuba
Introduction.
This paper summarizes the contribution by the Technical Group for Modelling and Epidemiology to face COVID-19. The objective was to create knowledge and scientific evidence to support the Government’s decision making, the health system and other sectors.
Methods
. Implementation research from a transdisciplinary perspective was carried out, with epidemiology providing the guidelines. Tools were developed to identify the magnitude and dissemination of COVID-19 in the country, as well as the analysis of the risk to get sick and severity; also, tools for the evaluation of the measures implemented.
Results and Discussion.
Improvements were made to the information systems and the Covid19CubaData platform was created to standardize and visualize the data. Prognosis mathematical models were developed. Geographical information systems were used to identify vulnerable population groups and stratify interventions. The impact of the actions was evaluated with a clinical-epidemiological analysis, as well as the use of big data techniques on mobility and real time estimation of the effective reproductive number. Multilevel and artificial intelligence models allowed for comparing the behavior of the pandemic in Cuba and the world. Indicators were brought forward for the de-escalation of the actions. The equity in the country’s response to COVID-19 was evaluated. It was concluded that the epidemiological research done, supported by modelling and the information systems, was useful for the government and the Ministry of Public Health to effectively respond to COVID-19.
Keywords: COVID-19; epidemiology; modelling; information systems
INTRODUCTION
The pandemic of COVID-19, caused by coronavirus SARS CoV-2, proved to have propagation mechanisms that favored its rapid expansion worldwide. 1) Until October 1, 2020, there were 34 million cases confirmed in 185 countries and 1 million deceased, lethality being 2.98%. 2 In the Americas, 16 million cases were confirmed, totaling 560 000 deceased people, lethality being 3.33%. 3) In the face of these big numbers, governments have deployed diverse response capacity. Health care services in many big cities and countries were strained, occasionally going beyond their resolution capacity and stirring human populations’ panic and despair. 4
In January, with the first report of COVID-19 cases in the Americas, the first signs of a potential crisis appeared. The Cuban government, together with the Ministry of Public Health (MINSAP in Spanish) and all the economic and social sectors involved, responded by mobilizing important scientific, technological, and professional capacities to face the pandemic. 5
On March 20, 9 days after the detection of the first three imported cases, the National Technical Group was activated, made up of academic experts and specialists from universities, research centers, and health care services, with the mission of advising and collaborating with the first level of the State direction in order to identify the magnitude and dissemination of the disease in the country, its risk and severity. 5
As part of this group, the Technical Group of Modelling and Epidemiology for facing COVID-19, composed of epidemiologists, mathematicians, specialists in computing sciences, physicists, and geographers, led research contributing criteria for the evaluation of intervention, the planning of resources, and the analysis of the epidemiological situation in both Cuba and the world. Besides, it also participated in analyzing and proposing measures to face the disease, modelling scenarios, and creating an interactive board to monitor and control the pandemic. 6
This paper summarizes the contribution of the Technical Group of Modelling and Epidemiology for facing COVID-19 from the studies conducted since the beginning of the pandemic in Cuba until October 31, 2020 as part of the actions to face this epidemiological process. One of the objectives was producing knowledge and providing scientific evidence to support decision making and the measures taken by the government, as well as the national health care system, and other sector of society; another objective was proposing and developing tools for its evaluation.
METHODS
The contributions to knowledge presented in this paper are described through a sequence of studies following the implementation research methodology. This permitted increasing the systematic use of research results in practice, maximizing its effectiveness, and impacting the social and governmental policies.
From the diagnosis of the information required for decision making, the identification of data sources, and the information flow required, suggestions were made for improving MINSAP’s statistics system, while checking and validating data quality as well as improving the existing data bases were organized.
Data about confirmed COVID-19 cases, reported daily from March 11, 2020 to October 1, 2020 by all 15 provinces and 168 municipalities, were used. For each province and municipality, the number of accumulated cases was registered, as well as the population recount in age groups of 5 years. The demographical data about the population size, the population density, urbanization, male rate, and aging rate were supplied by National Office of Statistics (ONEI in Spanish). 2019 population median estimates were used.
The monitoring of the epidemiological chain of cases was achieved by means of the epidemiological surveys conducted by health care professionals at a local level. The source of infection of the majority of patients was found. It was determined whether the transmission took place in the province or was imported. For that purpose, the official data of the statistic departments of the Ministry of Health Care were used. The data about the prevalence of associated comorbidities (hypertension, ischemic heart disease, cancer, diabetes mellitus, asthma, chronic obstructive pulmonary disease) were obtained from the Department of Medical Registry and Statistics of the Ministry of Public Health as well as the Provincial Departments of Health and those of Hygiene and Epidemiology.
All the data were related to geographical coordinates by means of a unique municipal code. The latitude and longitude of the center in each municipality were taken from the cartographical data of GEOCUBA, on a scale of 1:25000. The demographical characteristics of the countries used for comparison with Cuba in the study were obtained from the website http://www.woldometer.info.Thenotified cases confirmedforthecountrieswereobtainedfromhttp://pomber.github.io/covid19.
Modeling of the pandemic in Cuba
The science-politics association established by the highest direction of the country permitted the mutual definition of priorities in terms of research questions that varied as the pandemic evolved. 7,8) Dynamic modeling strategies, statistics, artificial intelligence, and intensive computer techniques were used for the analysis of a large volume of data and spatial modeling. 9
The dynamic models were the base for the prognosis of the COVID-19 epidemic in Cuba. They allowed for considering the number of active cases per day, as well as predicting the number of recovered patients in the population. An advantage of these methods is that they provide a global view over the duration of the pandemic, the hospitalization peaks. They also help to know the number of beds and other health care resources needed in each period. Besides, the SIR model (susceptible-infected-recovered) with temporary coefficients and SIR with demography, 10-12 two variants of SIR models were implemented: a) aimed at representing the transmission dynamic of COVID-19 among the symptomatic and asymptomatic infected populations, with functions that simulate the governmental and individual actions; b) aimed at adding and assessing the effect of the risk perception, the quarantine, and the hospitalization of cases. 12-13
The phenomenological models have been another type of models developed and were used to produce forecasts in the short run at the national level and lead interventions at the provincial level. 14 The model was innovatively adapted so as to estimate and predict the occurrence of multiple waves in real time. Additionally, a non-linear model with mixed effects was developed, which permitted adding the heterogeneity at the provincial level. 15,16
As to the simulation models, two approaches were used, the first with ramification processes while in the second artificial intelligence techniques were used. The ramification processes are of a special interest over the first phase of an epidemic, or when a subsequent outbreak occurs. They permit simulating the median number of infected and accumulated individuals in a particular moment and estimating the probability for the transmission to end. The models based on micro simulations were another type of models used for both forecasting the behavior of the epidemic and planning different interventions. In this case, both each person’s behavior and the processes that person goes through during the disease are modeled. 16-18
The behavior of the total rate of confirmed cases in Cuba is compared with that of other countries, using multilevel models for longitudinal data. 19 The main objective is obtaining predictions of the expected evolution of this indicator in our country, taking into consideration what happened in countries with conditions similar to those of Cuba. Models of artificial intelligence are complementary to this model. Based on data from 188 countries, it determines a group of countries similar to Cuba by adding different metrics of similitude on the basis of demographic data, non-pharmacological interventions, and the evolution of the epidemiological curves. 20) In the spatial modeling of the pandemic, several systems of geographical information were used for the cartographical representation and the spatial analysis of the data related to COVID-19. The models were structured in three dimensions. The first refers to the study of risk groups of people who are 60 years old and more, who also suffer from chronic diseases [hypertension, diabetes mellitus, is chemic heart disease, bronchial asthma, chronic obstructive pulmonary disease (COPD), and cancer], given the odds they have, once COVID-19 has been contracted, to develop a clinical scenario in which they go fast into severe and critical stages, ending with death. 21) Second, the health care are as most vulnerable to the virus transmission are identified in Havana province, taking account of population density, centers that bring crowds, population overcrowding, and the existence of slums. 22) Third, the study of the geographical distribution of the accumulated incidence per 100 000 in habitants was added, as well as its relation with vulnerability to COVID-19. 23) The standard incidence ratios (SIR) were calculated fort he COVID-19 incidence in the 15 provinces and 168 municipalities of the country. Forth municipalities, the mitigated relative risks (RR) and the aposteriori probabilitiesoftheriskexcess (RR>1) were estimated, using a Bayesian conditional autoregressive model. 24) Later, regression modelseweradjusted in order to study the relationship between the transmission risk and the demographic characteristics. 9
Estimation of parameters and assessment of interventions
Estimating the strength of epidemics is of great concern for those in charge of formulating policies when transmission begins. The basic reproductive number (R0) is the most common measurement of this strength. It represents the median number of new cases produced after the introduction of an infected individual in a totally susceptible population. This parameter determines whether the transmission will end naturally (R0<1) or will evolve into an epidemic (R0>1). In the course of the epidemic, the value of the reproductive number changes because of the implementation of control measures, among other factors; that is why estimating this parameter over time turned out to be important (Rt). 7,25
Aiming to contribute to decisions related to the implemented clinical protocols, a clinical-epidemiological analysis was carried out, which described the incidence of confirmed cases, severe cases and deceased patients in different periods of time. 25) On the basis of adjusting logistic regression models, the odds ratios (OR) of both severity and death were estimated. 26 An analysis of the lethality time series was conducted. It was done according to epidemiological weeks so as to determine the changes over time and evaluate the effect of the changes in the clinical protocols implemented. 27,28
On the other hand, the use of big data techniques in the analysis of the data from the registries of the mobile phone towers, for the first time in Cuba, permitted the production of global and aggregated population’s mobility indicators, in order to evaluate the effect of the measures adopted by the government aimed at reducing mobility. 29
In order to determine the aggregated effects of the interventions carried out simultaneously, a model of logistic regression was tested with artificial intelligence techniques. That model considered the number of active cases over time as a dependent variable as a function of the implemented measures. The model was adjusted with information from 188 countries and permitted the determination of the relative significance of each intervention. If different countries implement the same interventions with similar positive results, such interventions will be greatly significant, and vice versa. (10, 30)
Finally, aiming to document the efficient and equitable answer to COVID-19 in Cuba, an analysis of selected relevant indicators was conducted; their comparison according to strata established based on living conditions was also carried out. The following factors were taken into account: number of doctors per 100000 inhabitants, number of PCR tests run per one million inhabitants, incidence rate per 100 000 inhabitants, number of contacts studied, those who turned out to be positive to SARS-CoV-2, number of deceased patients, the fatality rate and the Oxford index which evaluates the government’s response to the pandemic and permits comparing with other countries.29 The Network of the Americas for health care equity identified the cases that either contribute to health care equity or require action. An analysis of these cases was carried out for this research. 31
RESULTS
On the basis of diagnosing the information required for decision making, the computing platform Covid19CubaData was created to standardize and visualize the data (see figure 1). 30) This platform displays, in real time, oficial information details related to the number of cases diagnosed, those who recovered from the disease, those evacuated and the deceased ones. It also carries out statistical processing of variables such as age, sex, age group, location of cases, and clinical condition. Additionally, it shows graphics useful for comparing Cuba with the international situation and following up on events, indicators, and epidemiological parameters, as well as evaluating the government’s response by means of the Oxford index.

Figure 2 exemplifies graphic displays of some implemented models. It can be observed that, during the first epidemic wave, the report of cases behaved within the favorable scenario anticipated based on the SIR model implemented. Despite the data variability, the phenomenological model proved to be useful predicting the general multiwave behavior of the pandemic and permitted predicting the control of the pandemic in Cuba, which remains currently. On the other hand, in panels c and d, artificial intelligence models and multilevel models are shown. They permitted comparing the behavior of the pandemic in Cuba and that of other countries with sociodemographic characteristics similar to Cuba.
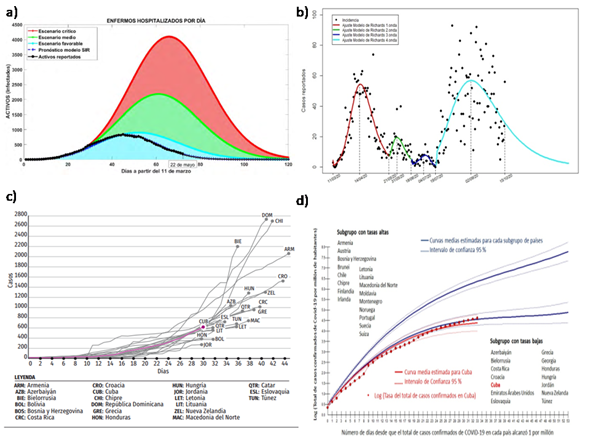
Fig. 2 A) Critical scenario (red), medium scenario (green), and favorable scenario (blue), simulated with SIR model with demography over the first weeks of the pandemic. The real data in black, which cover the period from March 11 to May 22, 2020. B) Adjustment and prediction of the multiwave phenomenological model implemented for the data of the period from March 11 to October 15, with a prediction until December. C) Curve of active COVID-19 cases in Cuba obtained by means of the simulation model with artificial intelligence techniques including the 20 countries most similar to Cuba. D) Comparison of the total rate of confirmed cases in Cuba in regard to the average growth of 2 subgroups of countries with characteristics similar to Cuba.
The system of geographical information and the spatial analysis developed permitted determining the areas with the highest vulnerability to COVID-19. Figure 3 shows how the areas classified as very high and high vulnerability are located on the central belt for both Cuba and Havana, which coincides with the spaces of highest population aging. The red dots in figure 3B) represent the spatial location of the cases. It is observed that the highest transmission occurred just in the areas defined by the model as high vulnerability, integrally considering biological aspects, the prevalence of diseases, and the age structure, as well as social factors and living conditions.
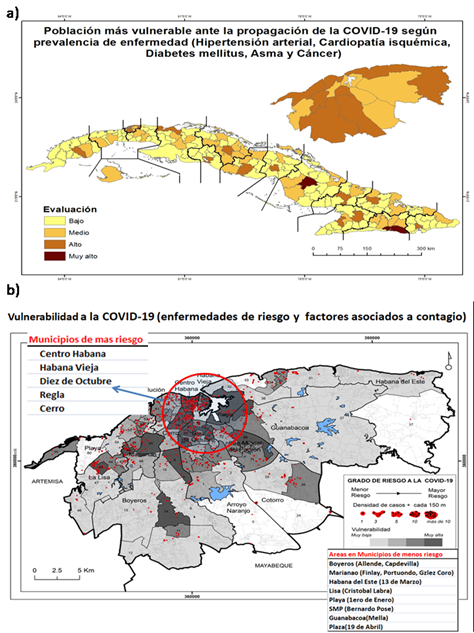
Fig. 3 Population most vulnerable to the propagation of COVID-19. A) for Cuba according to the prevalence of diseases (hypertension, ischemic heart disease, diabetes mellitus, asthma, and cancer; B) for Havana according to the prevalence of diseases and risk factors (population density, centers that bring crowds, population overcrowding, and the presence of slums).
Figure 4 shows the results of a) the estimate of the effective reproductive number in Cuba, b) the mobility index for four western provinces of the country, from March 11 to September 1, and c) the incidence rate of confirmed COVID-19 cases and Oxford standard index for Cuba, from March 11, 2020 to September 30, 2020. These indicators turned out to be very useful to follow up on the behavior of the pandemic; they show the effectiveness of the control measures and the government’s response to the pandemic.
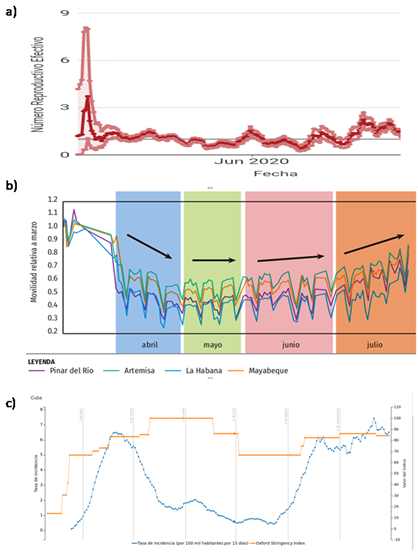
Fig. 4 Evolution of A) effective reproductive number, B) population’s mobility index of March. Data from March 11, 2020 to July 31, 2020, C) Incidence rate of confirmed COVID-19 cases and Oxford standard index in Cuba from March 11, 2020 to September 30, 2020.
As to the equity of structures and the processes that exist and reproduce in the health care system, in the context of facing the COVID-19 pandemic in Cuba, the National Health Care System is worth mentioning. Its service is universal and it is based on the strategy of Primary Health Care. It includes 449 clinics and 26173 community doctor’s consultation offices. Hospital beds were exclusively used for COVID-19 patients, 1103 of them in centers for taking care of suspects and in quarantine centers, 3636 in centers for monitoring COVID-19 patients’ contacts, and 4039 for travelers, all of them to meet the needs and solve the epidemiological situation of localities. The low fatality rate reflects the quality of the protocol used and the fulfillment of the equity principles since free health care and treatment was provided to those who needed it.
Several factors permitted the control of the disease from the perspective of health care equity, that is, the drafting of a unified national plan, the use of specific strategies for detection, diagnosis and tracking of cases in the primary health care system, the implementation of a unique response protocol, as well as the response of the government and that of various interconnected sectors. 31
DISCUSSION
The above-described results have had a scientific impact. They have contributed to identifying the magnitude and dissemination of the pandemic, as well as its risk and severity. They have also contributed to evaluating interventions, planning the resources of the national health care system to face the pandemic, and analyzing the epidemiological situation of Cuba in the international context.
The different pieces of research were aimed at prediction, the design of courses of action, the improvement of therapeutic protocols, the management of the actions to face the pandemic, and the improvement of the action models used to reduce risks and vulnerabilities.
The dynamic models were added to the campaign aimed at raising the population’s awareness about the need for anti-epidemic measures; also for providing information to the health care personnel, who used this tool in their everyday work to control the epidemic in the country.
The scientific work done led to the creation of a knowledge basis widely used to support the government’s management of the actions to face the pandemic. This confirmed the capacity and convenience of achieving a close collaboration between scientific teams and the government.
The research showed its usefulness to formulate and evaluate public policies. This permitted making decisions based on science. This scientific result, as others, has given Cuba great visibility and has contributed to its prestige as a referent to respond to COVID-19.
REFERENCIAS BIBLIOGRÁFICAS
1. WHO. Coronavirus disease (COVID-2019) situation Reports. World Health Organization. [internet] 2020 [Consultado 21 May 2020]. Disponible en: https://www.who.int/emergencies/diseases/novel-coronavirus-2019/situationreports/ [ Links ]
2. Coronavirus update [Internet] 2020 [Consultado 30 Oct 2020]. Disponible en: http://www.worldometers.info [ Links ]
3. MINSAP. Gracias por salvar vidas. Sitio Web MINSAP. Ministerio de Salud Pública. [Internet] 2020 [citado 25 Nov 2020]. Disponible en: https://salud.msp.gob.cu/ [ Links ]
4. New cases of COVID-19 in World countries. Have countries flattened the curve? [Internet]. Baltimore: Johns Hopkins Center for Systems Science and Engineering; [Consultado 8 Jul 2020] Disponible en: https://coronavirus.jhu.edu/data/new-cases [ Links ]
5. Díaz Canel M, Nuñez Jover J. Gestión gubernamental y ciencia cubana en el enfrentamiento a la COVID-19. [Internet].AnAcadCienc Cuba. 2020 [citado 25 Nov 2020];10(2). Disponible en: http://www.revistaccuba.sld.cu/index.php/revacc/article/view/881/887 [ Links ]
6. Más Bermejo PI. La COVID-19 y la práctica epidemiológica en Cuba. Rev Cubana HigEpidemiol [Internet] 2020 [citado 25 Nov 2020];57. Disponible en: http://www.revepidemiologia.sld.cu/index.php/hie/article/view/307 [ Links ]
7. Más Bermejo P, Vidal Ledo MJ, Baldoquín Rodríguez W, Seuc Jo AH, Guinovart Díaz R, Noriega Bravo V, Pérez Rodríguez N, et al. Organización de la investigación epidemiológica para la lucha antiepidémica contra la COVID-19 en Cuba. INFODIR [Internet] 2020 [citado 25 Nov 2020];(32). Disponible en: http://revinfodir.sld.cu/index.php/infodir/article/view/831 [ Links ]
8. Sánchez et al. COVID-19 in Cuba, The interplay of government and societal actions with statistics. Radical statistics 2020, Issue 126 Special Coronavirus Issue. Disponible en: https://www.radstats.org.uk/no126/Cuba126.pdf [ Links ]
9. Sánchez et al. How mathematical approaches could help decision-making to epidemic control: The successful experience against COVID-19 in Cuba. Disponible en: Social Science Research Network: https://ssrn.com/abstract=3629271 [ Links ]
10. Universidad de La Habana. Modelación de la COVID-19 en Cuba. [Libro en prensa.]. Editorial UH. 2020 [ Links ]
11. Guinovart Díaz R, Abelló Ugalde IA, Morales Lezca W. Modelo SIR para el seguimiento de la COVID-19 en Cuba, Ciencias Metemáticas. 2020;34(1). [ Links ]
12. Vidal Ledo MJ, Guinovart Díaz R, Baldoquín Rodríguez W, Valdivia Onega NC, Morales Lezca W. Modelos matemáticos para el control epidemiológico. Educación Médica Superior [Internet] 2020 [citado 25 Nov 2020];34(2):e2387. Disponible en: http://www.ems.sld.cu/index.php/ems/article/view/2387 o http://scielo.sld.cu/scielo.php?script=sci_arttext&pid=S0864-21412020000200026 [ Links ]
13. Abello I, et al. El modelo SIR básico con parámetros variables y políticas anti epidémicas de salud pública. Ejemplo de la COVID-19 en Cuba. Rev. Cubana de Salud Pública. 2020:46(Suplemento Especial). Disponible en: http://www.revsaludpublica.sld.cu/index.php/spu/search/search [ Links ]
14. Marrero Severo A, Menció Padrón D, Bayolo Soler G. Modelo SEAIR con percepción de riesgo para la COVID-19. Caso Cuba. Ciencias Metemáticas. 2020;34(1). [ Links ]
15. Menció Padrón D, Bayolo Soler G, Marrero Severo A. Evolución de la COVID-19 a partir de un Modelo SAIRV con tasa de transmisión variable ante percepción de riesgo, cuarentena y hospitalización. Caso Cuba. Ciencias Metemáticas. 2020;34(1). [ Links ]
16. Mesejo Chiong JA, Mireya León Mecías A. Modelos fenomenológicos aplicados al estudio de la COVID-19 en Cuba. Ciencias Metemáticas. 2020;34(1). [ Links ]
17. Crespo Navas M, de la Cruz Cobas PP, Quevedo Caballero E, Valdes Castro JE. Los procesos de ramificación y su aplicación al estudio de la transmisión de la COVID-19 en Cuba. Ciencias Metemáticas. 2020;34(1). [ Links ]
18. Sebrango Rodríguez CR, Sánchez Valdés L, Baldoquín Rodríguez W, Norman Montenegro O, Guinovar R. Predicciones en tiempo real de la COVID-19 en Cuba y sus provincias. Modelos fenomenológicos. Ciencias Metemáticas. 2020;34(1). [ Links ]
19. Montero Díaz M. Un modelo multinivel para la predicción del total de casos confirmados de COVID-19 en Cuba. Ciencias Metemáticas. 2020;34(1). [ Links ]
20. Almeida Y. Aplicaciones de la inteligencia artificial ante la COVID-19 en Cuba. Libro UH en prensa 2020 [ Links ]
21. Pérez Rodríguez N, Guinovart Díaz R, Almeida Cruz Y, et al. Atlas de la COVID-19. [en prensa]. Editorial UH. 2020 [ Links ]
22. Distribución de la población vulnerable a la enfermedad COVID-19 en La Habana, Cuba. Rev Cubana de Higiene y Epidemiología. 2020;57(E371) Disponible en: http://www.revepidemiologia.sld.cu/index.php/hie/article/view/371 [ Links ]
23. Pérez Rodríguez N, Más Bermejo P. SIG y análisis espacial aplicados para identificar riesgos de COVID-19 en Habana, Cuba. JournalAppliedGeography (En prensa). 2020 [ Links ]
24. Lorenzo Luaces P, Torres Reyes A, Fonte P, Pérez N, Sánchez L. Análisis espacial de la incidencia de COVID-19 en pequeñas áreas geográficas en Cuba. Ciencias Metemáticas. 2020;34(1). [ Links ]
25. Vidal Ledo M, Baldoquín Rodríguez W, Duran García F, Más Bermejo P. Número Básico de Reproducción (Ro). [Internet]. Educación Médica Superior [En progreso.]. 2020 [citado 25 Nov 2020];34(4). Disponible en: http://www.ems.sld.cu/index.php/ems/editor/issueToc/54 [ Links ]
26. Guinovart Díaz R, Abelló Ugalde I, Morales Lezca W. La ocurrencia de rebrotes de la COVID-19 y su relación con el número reproductivo. Rev Cubana HigEpidemiol [Internet]. 2020 [citado 25 Nov 2020];57. Disponible en: http://www.revepidemiologia.sld.cu/index.php/hie/article/view/308 [ Links ]
27. Galban García E, Más Bermejo P. COVID-19 in Cuba. Assessing the National Response. [Internet]. Medicc Review. 2020 [citado 25 Nov 2020];22(4). Disponible en: https://mediccreview.org/covid-19-in-cuba-assessing-the-national-response/ [ Links ]
28. Castillo Sanz JU, Lorenzo Luaces P, Pereda Gonzalez R, Vidal Ledo MJ, Hidalgo Sánchez AO, Sabina RR, Sáncez Valdés L. Caracterización clínica y efectividad del tratamiento de pacientes ingresados por la COVID-19 en Terapias Intensivas en Cuba. (En prensa) Rev. Cubana de Salud Pública. 2020 [ Links ]
29. Funes Torres L, Mastrapa Noa T, Rojas Sardiñas Y. Análisis estadístico del comportamiento de la COVID-19 para la vigilancia epidemiológica en Cuba. [Tesis]. Facultad de Tecnología de la Salud Salvador Allende. 2020. [ Links ]
30. Postdata. club, Juventud Técnica Magazine, School of Math and Computer Science of Havana University and collaborators, COVID19 Cuba Data Dashboard and Data[Sitio Web]. 2020 [citado 26 Nov 2020]. Disponible en: https://covid19cubadata.github.io/ [ Links ]
31. Mas Bermejo P, Sánchez Valdés L, Somarriba López L, Valdivia Onega C, Vidal Ledo MJ, Alfonso Sánchez I, et al. Equidad y respuesta del Sistema Nacional de Salud de Cuba ante la COVID-19. Rev Panam Salud Publica. 2020;44:exx. https://doi.org/10.26633/RPSP.2020.xx [ Links ]
Received: March 08, 2022; Accepted: May 26, 2022
 Este es un artículo publicado en acceso abierto bajo una licencia Creative Commons
